Histology and Slide Scanning
March 2022
Microscopy has evolved over the years since the development of the first instruments to visualize microscopic objects centuries ago. While many researchers are familiar with using a conventional microscope to view specimens on a glass slide, recent advances in automated digital microscopy systems and image analysis tools deliver considerable improvements to histology and slide scanning workflows. It is now possible to capture, archive and analyze digitized images of microscopic samples, spanning a diverse range of research fields and applications, using a single benchtop automated imager. Additionally, powerful image processing and analysis tools enable efficient whole slide imaging at low magnification with auto detection of defined regions of interest (ROI), that are then targeted for imaging at higher magnification.
In this TekTalk we’ve compiled a variety of resources that describe the unique combination of hardware and software features available with the Agilent BioTek imaging systems for conducting histology and slide scanning applications, as well specific tips and guidance for optimizing your workflows.
Featured Applications
Hematoxylin and Eosin Stained Tissue
The imaging and analysis of labeled fixed and chromogenically stained cells has traditionally been accomplished using manual examination of microscopic slides with a multi-objective staged microscope. With the advent of digital color brightfield imagery, samples can be automatically imaged and the data stored for examination independent of the microscope. This application note describes the use of the Agilent BioTek Cytation 5, a low-cost high-value combination cell imager and microplate reader, to rapidly image hematoxylin and eosin-stained tissue slides.
Detection and Automated Imaging of Regions of Interest (ROIs) when Performing Whole Slide Imaging (WSI)
In today’s research and clinical environments, there is a movement towards Whole Slide Imaging (WSI) as a means to transform physical specimens mounted on traditional microscopy slides or various sample vessels into a digital medium. Once digitized, the data can then be easily stored as a shared resource for a variety of purposes including pathology, diagnostics, and as scientific research and educational tools.
Product Spotlight
BioTek Cytation 7 Cell Imaging Multimode Reader
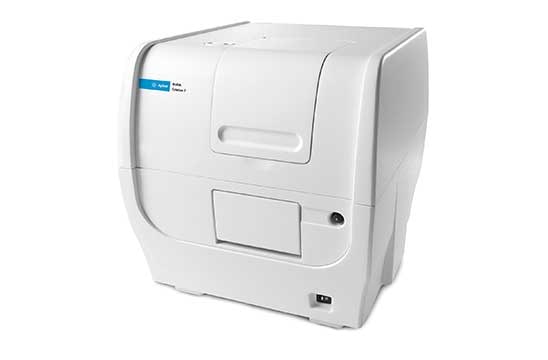
The BioTek Cytation 7 cell imaging multimode reader combines automated digital upright and inverted widefield microscopy with monochromator-based multimode microplate reading. The inverted microscope provides 1.25x to 60x magnification in fluorescence, brightfield and color brightfield, while the upright microscope enables other common applications including ELISpot, slide scanning and ROI detection.
Tek Tips
Consistency with Sample Preparation leads to Successful Imaging
Embedding
- Eliminate air bubbles surrounding tissue when embedding samples to prevent downstream tearing and section damage. Whether it’s paraffin or Tissue-Tek® O.C.T. for cryosectioning, it is imperative to submerge tissue within the mold long enough to allow bubbles to escape. The use of a vacuum with O.C.T. can assist with air release within whole tissues.
- Before the embedding medium solidifies, position the preferred tissue surface to the bottom of the mold for alignment for the microtome blade for sectioning.
Staining
- For Immunohistochemistry (IHC), explore a variety of blocking buffers to determine which is best for each tissue type to allow for specific primary antibody binding.
- When using a low volume of antibody, parafilm can be cut to fit over the tissue sections allowing the antibody solution to evenly cover sections while minimizing evaporation.
- Consistent timing for staining reagents is critical among all samples for quantitative and qualitative analyses.
Considerations for Histology Image Capture, Processing, and Analysis in Gen5
ROI capture selection
- When selecting a region of interest (ROI), a montage acquisition is activated, and it is important to be aware of how large a single ROI is defined. A maximum of 2000 images can be captured for each channel within a single ROI. For example, if Z-stacking or high magnification imaging is preferred, a smaller region of interest/montage may need to be considered.
Color Brightfield Analysis
- When imaging Color Brightfield images, Red, Blue, and Green color channels are acquired. The channel with the greatest contrast is the preferred selection in determining the primary mask.
- When analyzing large tissue sections, consider adjusting the Background flattening parameter within cellular analysis in the Advanced detection options. The default setting is often a large Rolling Ball diameter value, as a result of a sizeable montage acquisition; this high value can affect analysis speed. For faster analysis, decrease the rolling ball size (consider reducing the value to be 1-3X the size of the objects of interest in the image), or deselect the Background flattening option entirely if there is no need to isolate smaller objects within the primary mask.
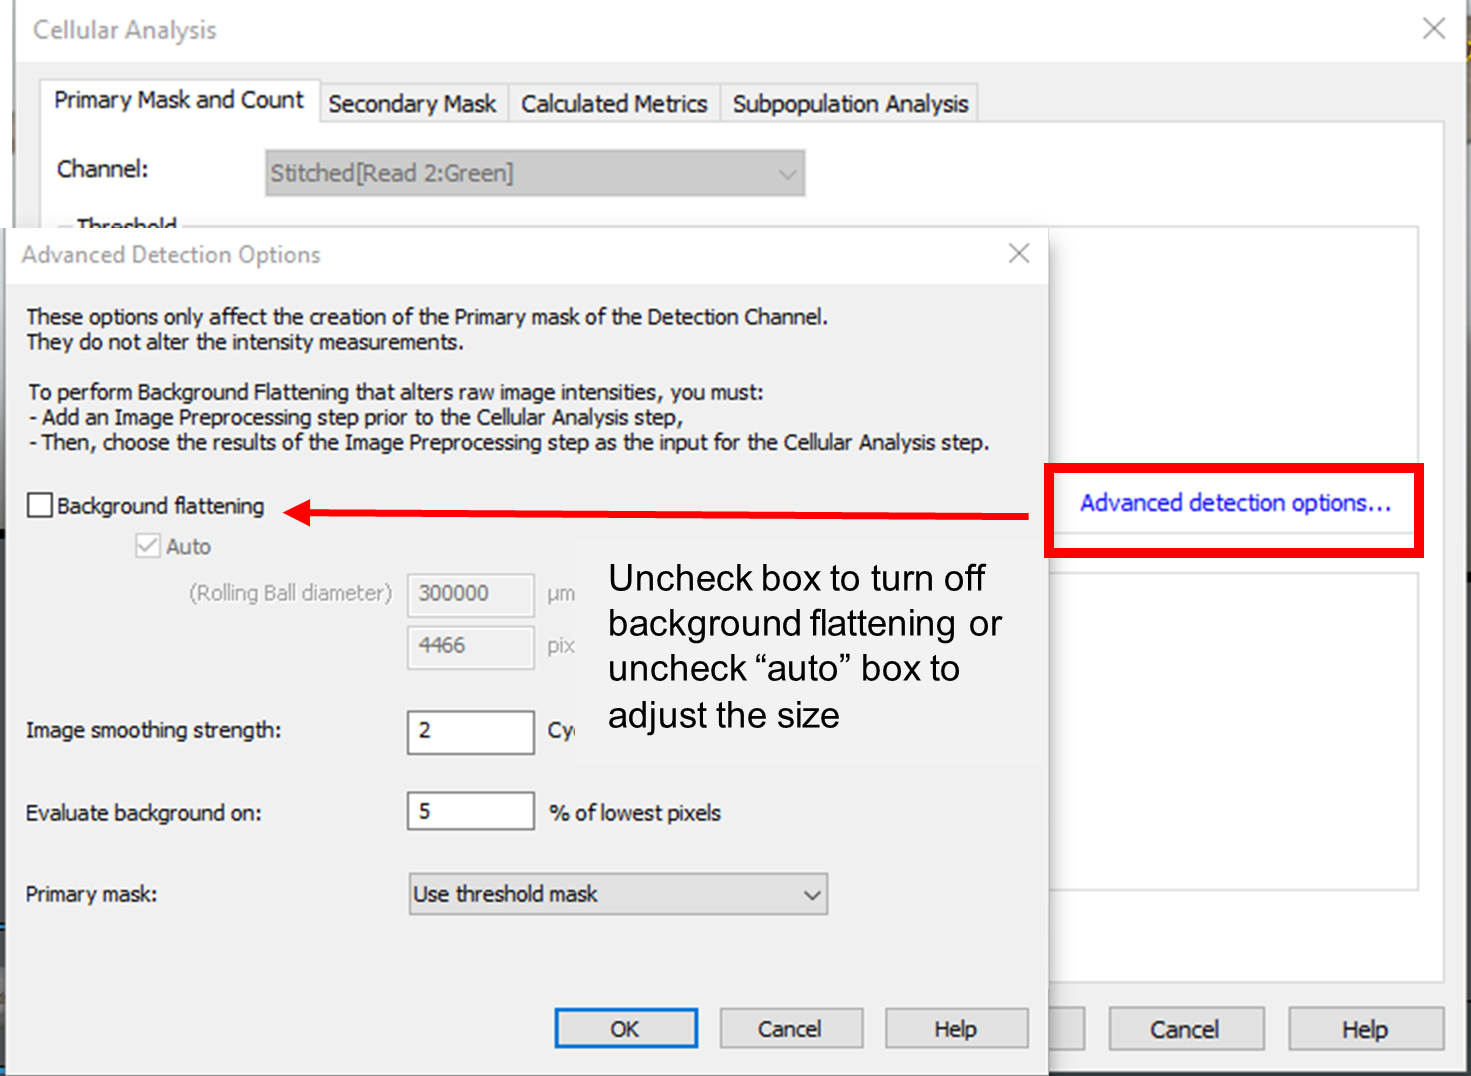
Figure 1. Gen5 Cellular Analysis. When analyzing large histology sections, select the Advanced detection options within the Primary Mask and Count tab and turn off background flattening to decrease analysis time. Alternatively, a reduced rolling ball size can be applied, also decreasing analysis time, if the goal is to isolate smaller objects in the image.
Histology Analysis using the Spot Counting Module
- The Spot Counting Module can be utilized to quantify positively stained regions inside tissue sections. Within cellular analysis, the full tissue area can be defined and outlined in the Primary Mask and Count tab with size modifications. In the Secondary Mask tab, the Spot Counting Module can be utilized; Count Spots can be selected to identify the positively stained areas in the sample (colorimetric examples include: DAB-positive brown stain; Masson Trichrome-positive navy stain; or Picrosirius Red stain). The metric of Object Spots Sum Area can be used to evaluate the total positive tissue area and a percentage relative to the total tissue area can be determined.
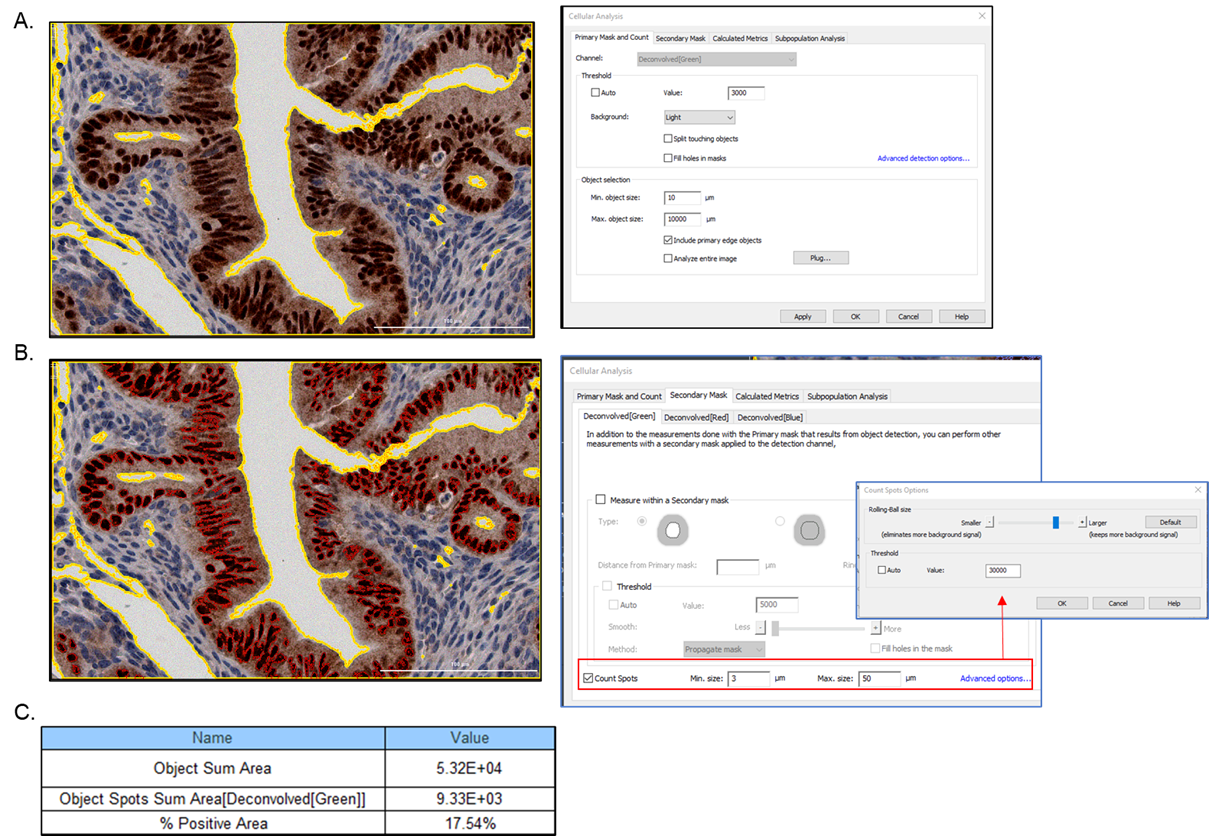
Figure 2. Mouse oviduct imaged at 20x magnification in Color Brightfield. A) The total tissue area (yellow contour) was defined using the Primary Mask and Count tab, with the green channel chosen for greatest contrast. To accurately encompass the full tissue area, Maximum object size was increased, Split touching objects was turned off, and Fill holes in mask was deselected to exclude empty regions within the section. B) To identify positively stained areas, the Spot Counting Module was utilized and Count Spots was selected within the Secondary Mask tab. The Advanced options were utilized to set the threshold intensity to define the brown DAB-stained areas, or ‘spots’ (this area is much darker than the surrounding tissue). Positive areas of the image identified by the Spot Counting Module are outlined with a red contour. C) The selected metrics of interest define the total tissue area as the Object Sum Area (identified by the primary mask) and the total area of positive-stained brown tissue as the Object Spots Sum Area (identified by the secondary mask- Count Spots criteria); the positively stained tissue percentage can then be calculated.
