Access Agilent eNewsletter August 2016

High sensitivity analysis of silicon-based nanoparticles using new Agilent 8900 ICP-QQQ
Michiko Yamanaka
Agilent Applications Engineer
Takayuki Itagaki
Agilent Software R&D Engineer
Steve Wilbur
Agilent Software Product Manager,
ICP-MS Systems
Silicon dioxide (SiO2) nanoparticles (NPs) are used in a range of applications from paints, coatings, and adhesives, to food additives, cosmetics and polishing microelectronic devices. With increasing use, concerns have been raised about the impact of NPs on the environment, in food safety, and on human health. Clearly, there is a requirement to monitor NPs in a range of sample types, at low concentrations.
More options with triple quadrupole ICP-MS
ICP-MS can be used to measure individual NPs using a technique called Single Particle ICP-MS (spICP-MS), which allows simultaneous determination of the number, concentration, and size of particles present, as well as the dissolved element concentration. This type of measurement requires very fast Time Resolved Analysis (TRA) capability, which the Agilent 8900 ICP-QQQ achieves using a new detector with very fast integration time (0.1 ms dwell).
Low-level Si measurement using conventional quadrupole ICP-MS is difficult, due to intense background polyatomic ion interferences from CO and N2, which overlap the major isotope of Si at m/z 28 (28Si – 92.23% abundance). The interferences can be addressed using reaction chemistry in the collision/reaction cell of an ICP-MS, but for controlled and consistent reaction processes, a tandem mass spectrometer instrument, such as the Agilent 8900 ICP-QQQ, is required. Furthermore, the elemental background signal for Si is typically high, due to the presence of Si in many common polymers, sealants, cleaning agents and other laboratory reagents. The Agilent 8900 Advanced Applications configuration used in this work includes a new argon gas flow system that utilizes special inert materials to minimize the signal due to Si (and S) contamination from the ICP-MS hardware. In this way, a very low detection limit specification of < 50 ppt for Si can be achieved.
Double mass selection capability solves even the most challenging spectral overlaps
The 8900 ICP-QQQ uses two quadrupole mass filters (Q1 and Q2), with an octopole reaction cell located between them, to provide a double mass selection capability, commonly termed MS/MS. In our example, the 28Si signal was measured on-mass in MS/MS mode, where Q1 and Q2 were both set to m/z 28. Hydrogen cell gas was used to eliminate any on-mass polyatomic interferences, such as 12C16O and 14N2, allowing accurate measurement of Si at low levels, while MS/MS prevented the formation of any new, overlapping reaction product ions.

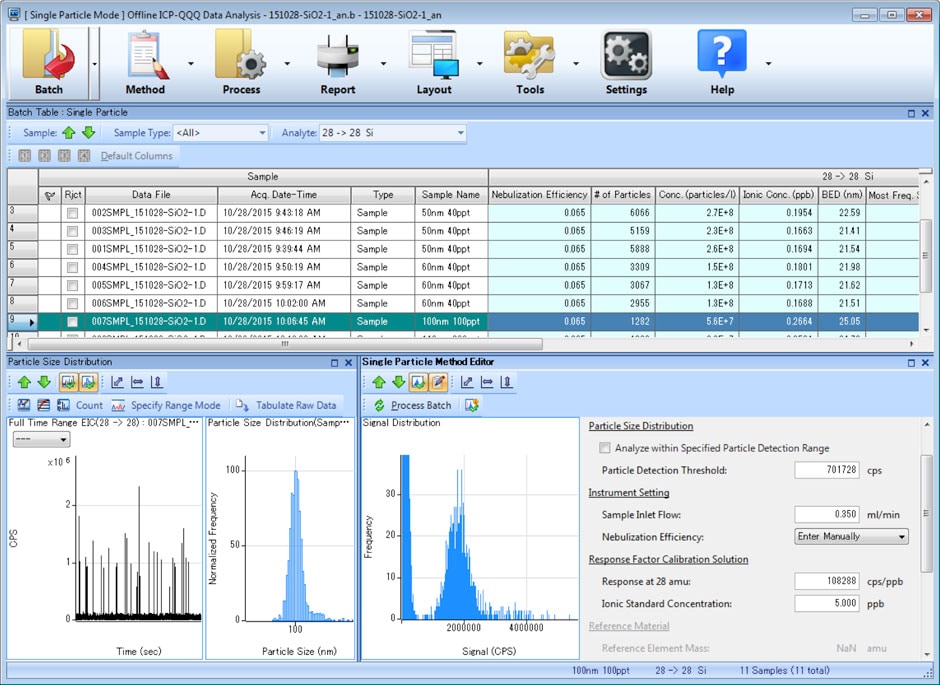
Figure 1. Data view from the Single Nanoparticle Application Module software.

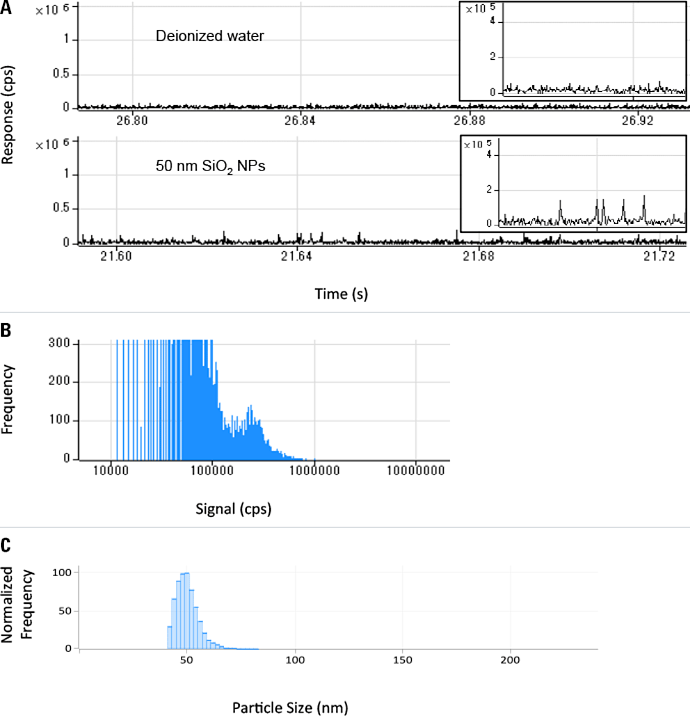
Figure 2. A: Measured signal, B: frequency distribution, and C: particle size for 50 nm SiO2 NPs (40 ng/L).

Figure 3. Size distribution results of 100 nm and 200 nm SiO2 particles in 1% ethanol.
Automated acquisition and calibration approaches support NP characterization
The optional Single Nanoparticle Application Module of the Agilent ICP-MS MassHunter software was used for method setup and data analysis. Sample results for an entire batch are summarized in the ‘Batch at a Glance’ pane, which displays detailed graphical results for the selected samples, permitting visual confirmation and optimization of particle threshold and method settings if needed (Figure 1).
Accurate analysis of silica nanoparticles
Analyses were performed using the Agilent 8900 ICP-QQQ in fast TRA mode, using a dwell time of 0.1 ms (100 µs) per point with no settling time between measurements. Fast TRA allows multiple measurements to be made during the signal peak from a single particle, so the shape and duration of the ion plume from each NP can be identified. Small 50 nm SiO2 particles provided clear peaks that were easily distinguished from the baseline signal and the low background signal observed in DI water (Figure 2A).
Figure 2C confirms that 50 nm SiO2 particle sizes could be determined accurately, as a result of the low Si background and effective removal of polyatomic interferences in MS/MS mode with H2 cell gas, combined with the high sensitivity of the 8900 ICP-QQQ.
Real sample analysis requires removal of carbon interference
Samples such as biological fluids and tissues, food matrices, pharmaceutical ingredients, and organic solvents contain carbon matrices which cause a 12C16O polyatomic ion interference on 28Si. The Agilent 8900 ICP-QQQ in MS/MS mode with hydrogen cell gas can eliminate this interference effectively. The particle size distribution for a mixed solution of the 100 nm and 200 nm SiO2 particles, measured in a sample containing 1% ethanol is shown in Figure 3. Despite the high concentration of carbon, the size distribution for each group of particle sizes was consistent with the result obtained by Transmission Electron Microscopy (TEM), and the different particle sizes were separated with excellent resolution. This result suggests that the spICP-QQQ technique can resolve matrix interferences to allow accurate determination of particle sizes for SiO2 nanoparticles in real sample matrices.
Characterize a wider range of NPs with Agilent 8900 ICP-QQQ
The Agilent 8900 ICP-QQQ with dedicated MassHunter spICP-MS software provides fast analysis times, excellent detection limits for particle size and concentration, and accurate results for SiO2 particles less than 100 nm.
Learn how to leave interferences behind with MS/MS, then download Agilent publication 5991-6596EN for more details on this application.
Agilent ICP-MS Journal
Are you interested in trace metals analysis and eager to keep up-to-date with the latest developments in the field of ICP-MS? Then take a closer look at Agilent’s dedicated ICP-MS Journal. Published four times a year and available as a PDF, you can view the latest issue of the ICP-MS Journal, plus all previous copies, by visiting the ICP-MS Journal Archive.
To receive a personal copy of the ICP-MS Journal direct to your inbox, please sign up here.
Stay informed about the applications that are important to you
Subscribe to Access Agilent
Our free customized
monthly eNewsletter
Article Directory – August 2016
All articles in this issue
-
 Best practices: Analysis of extractable and leachable impurities in pharmaceutical packaging components and beyond
 -
 Ask the Expert: How can I quickly and easily identify different lipid classes?
 -
 How a busy metabolomics lab in Montreal collects and shares data: Agilent OpenLAB ELN success story
 -
 Quality-by-design (QbD) approach to method development delivers robust peptide mapping method in far less time
 -
 High sensitivity analysis of silicon-based nanoparticles using new Agilent 8900 ICP-QQQ
 -
 PerkinElmer FAAS with Agilent consumables: Accurate determination of nutrients and mineral elements in water samples
Figure 1

Data view from the Single Nanoparticle Application Module software.
Figure 2

A: Measured signal, B: frequency distribution, and C: particle size for 50 nm SiO2 NPs (40 ng/L).
Figure 3

Size distribution results of 100 nm and 200 nm SiO2 particles in 1% ethanol.