Access Agilent eNewsletter August 2016

Ask the Expert: How can I quickly and easily identify different lipid classes?
Seetaramanjaneyulu Gundimeda, Agilent Application Scientist
Lipidomics is a fast growing area of research focused on lipids. Expansion in the field has been largely driven by major advances in technologies such as mass spectrometry (MS) and the discovery of linkages between lipid profiles with certain metabolic diseases, such as obesity, hypertension, stroke, and diabetes.
Lipids can be analyzed via LC/MS in either normal phase or reversed phase. Lipids have two important components in their structure: a polar head and a hydrophobic tail. As explained in an earlier Access Agilent article, lipids formed with a glycerol backbone are called glycerol lipids.
Signature ions in glycerophospholipids aid in their identification
The alcohol groups of the glycerol can be esterified with long chain fatty acids. When one of the alcohol groups is attached to a polar group (ex: phosphate, phosphocholine, phosphoethanolamine, and phosphoserine), they are called glycerophospholipids. Glycerophospholipids demonstrate characteristic ions in the MS/MS spectra that help in their identification. Lipidomic scientists worldwide use these signature ions for the identifications of the lipids. The diagnostic ion/features shown by some of the lipid classes are given in Table 1.
| Lipid class | Positive mode | Negative mode |
|---|---|---|
| Phosphatidyl cholines (PC) | Fragment ion 184 | Neutral loss 60 from formate adducts, Neutral loss 74 from acetate adduct |
| Phosphatidyl Ethanolamines (PE) | Neutral loss 141 | Fragment ion at m/z 140 or m/z 196 |
| Phosphatidyl serine (PS) | Neutral loss 185 | Neutral loss 87 |
| Phosphatidic acids (PA) | Fragment ion 225 | Fragment ion 153 |
| Phosphatidyl inositol (PI) | Fragment ion 241 | |
| sphingomyelin | Fragment ions 184 and 264/266 | Fragment ion 168 |
| ceramides | Fragment ions 264 and 282 | Fragment ion 237 |
| dihydroceramides | Fragment ions 266 and 284 | Fragment ion 239 |
Table 1. Diagnostic features of different phospholipid classes in their MS/MS spectra
Filtering data by fragment mass simplifies lipid analysis
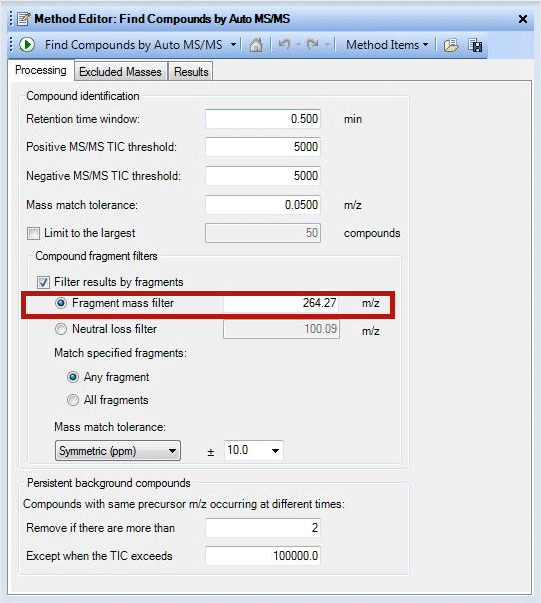
Information about diagnostic features of different phospholipid classes is very useful in identifying lipids when they are in a mixture. Filtering the data from the information in Table 1 with the Agilent MassHunter Qualitative Analysis software tool can simplify lipid analysis in many ways. The ‘Filter results by fragments’ feature is one such method, as it helps to filter the data based on the fragment mass or neutral loss of interest. By clicking the ‘Find compounds by Auto MS/MS’ tab, one can access multiple filtering options. Data simplification of a lipid mixture to identify ceramides is shown in Figure 1. Retention time window and MS threshold parameters should be set after careful examination of the chromatogram. The accuracy of the fragment mass information is critical because mass match tolerance is set by the accuracy of the data and can influence the results a great deal. The same tool can be used to identify Phosphocholine containing lipids also by changing fragment mass filter to 184.073.
Filtering data by neutral loss also helps identify lipids
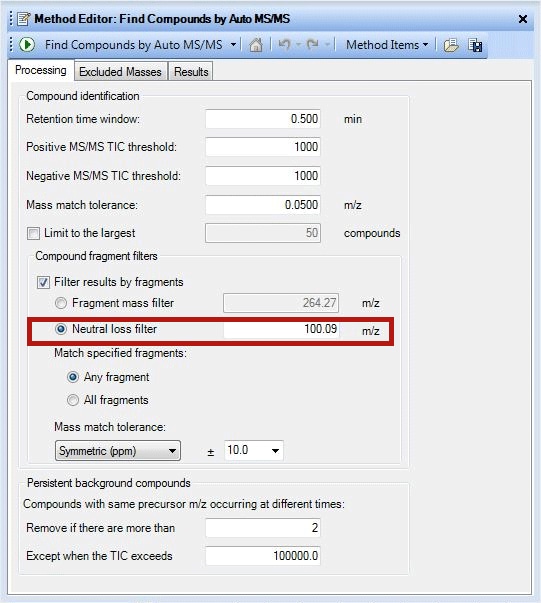
In a similar fashion, lipids can be identified by their characteristic neutral loss also. Phosphatidyl cholines (PCs) give a dominant ion at m/z 184 in positive mode in their MS/MS spectra. The same species demonstrate a neutral loss of 60 Da from its formate adducts or 74 Da from its acetate adducts in negative mode. Phosphotidyl ethanolamines (PE) show a characteristic ion at m/z 140 and at m/z 196 in negative mode. But in positive mode they show a dominant neutral loss of 141Da from the precursor. Based on the ionization mode used during data acquisition, both filtering by fragment ion and by neutral loss may be necessary to simplify the data. Prostaglandings, another lipid class can be identified by ‘Neutral loss filter’ 100.09Da (Figure 2).
By processing the data with a relevant diagnostic feature, a compound list can be generated. This compound list can then be exported to any spectral library to identify the compounds. To learn more about this application, please read Agilent publication 5991-6959EN.
Agilent provides a wide array of equipment and software to deliver fast, accurate lipid analysis
The importance of lipidomic research grows with each passing day. Agilent delivers a full range of LC/MS instruments, LC columns, and advanced informatics software that can help your busy research lab speed lipidomic analysis, while increasing accuracy and reducing costs. We encourage you to visit our Lipidomics Resources page to sign up for valuable free information (videos, webinars, articles, and more!) on this exciting field of research and Agilent’s related technologies. Contact your Agilent representative today to start putting these time-saving solutions to use in your research lab.
Stay informed about the applications that are important to you
Subscribe to Access Agilent
Our free customized
monthly eNewsletter
Article Directory – August 2016
All articles in this issue
 Best practices: Analysis of extractable and leachable impurities in pharmaceutical packaging components and beyond
 Ask the Expert: How can I quickly and easily identify different lipid classes?
 How a busy metabolomics lab in Montreal collects and shares data: Agilent OpenLAB ELN success story
 Quality-by-design (QbD) approach to method development delivers robust peptide mapping method in far less time
 High sensitivity analysis of silicon-based nanoparticles using new Agilent 8900 ICP-QQQ
 PerkinElmer FAAS with Agilent consumables: Accurate determination of nutrients and mineral elements in water samples
Figure 1

A screenshot demonstrating use of fragment mass filter.
Figure 2

A screenshot demonstrating use of neutral loss filter.