
Access Agilent eNewsletter September 2016

Multi-omic analysis helps researchers to integrate complex omics data in cancer research
Shweta Shukradas
Agilent Bioinformatics Product Manager
Carolina Livi
Agilent Academic Segment Manager,
Disease Research and Toxicology
Scientists today are often using multiple omics technologies to better understand the biological problem they are working on. This created a serious challenge to analyze increasingly large and complex data sets generated by genomics, transcriptomics, proteomics, and metabolomics experiments. An integrated approach for analyzing multi-omic data can significantly alleviate bottlenecks and provide valuable information that is often missed in individual experiments. Recently there have been several studies published demonstrating the successful integration of multi-omic data sets using Agilent GeneSpring Integrated Biology Software (including Mass Profiler Professional and Pathway Architect). This article highlights some of the key findings from select examples.
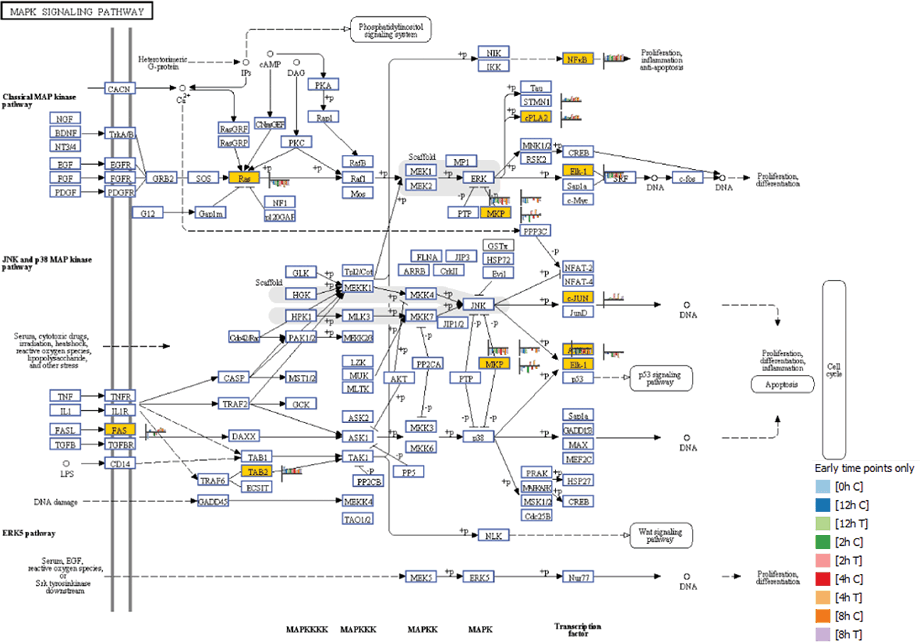
Figure 1. The MAPK signaling pathway at four hours post-SRL treatment. Yellow boxes indicate that transcripts were differentially expressed. The heat strips next to each entity illustrate gene expression levels for each time point.
Understanding mRNA-miRNA relationship using curated pathway analysis
To gain insight into the biological outcome of transcription, it is important to evaluate the expression of messenger RNAs (mRNA) and noncoding RNAs such as microRNAs (miRNAs). The apoptotic effects of SRL, a lectin produced by the fungus Sclerotium rolfsii, on the colon cancer cell line (HT29) were studied in an integrated analysis at the transcriptional level using pathway and correlation analysis [1].
Mitogen activated protein kinase (MAPK) genes showed marked differential regulation at early time points following SLR treatment (Figure 1). Other genes that showed regulation at early time points were MAP3K14 and DUSP1, which were up-regulated. As well as MAP3K4 and ATF2, which were down-regulated at two hours post SRL treatment. The results suggest that the induction of apoptosis by SRL is initiated by an interplay of phosphatases and kinases belonging to the MAP kinase pathway.
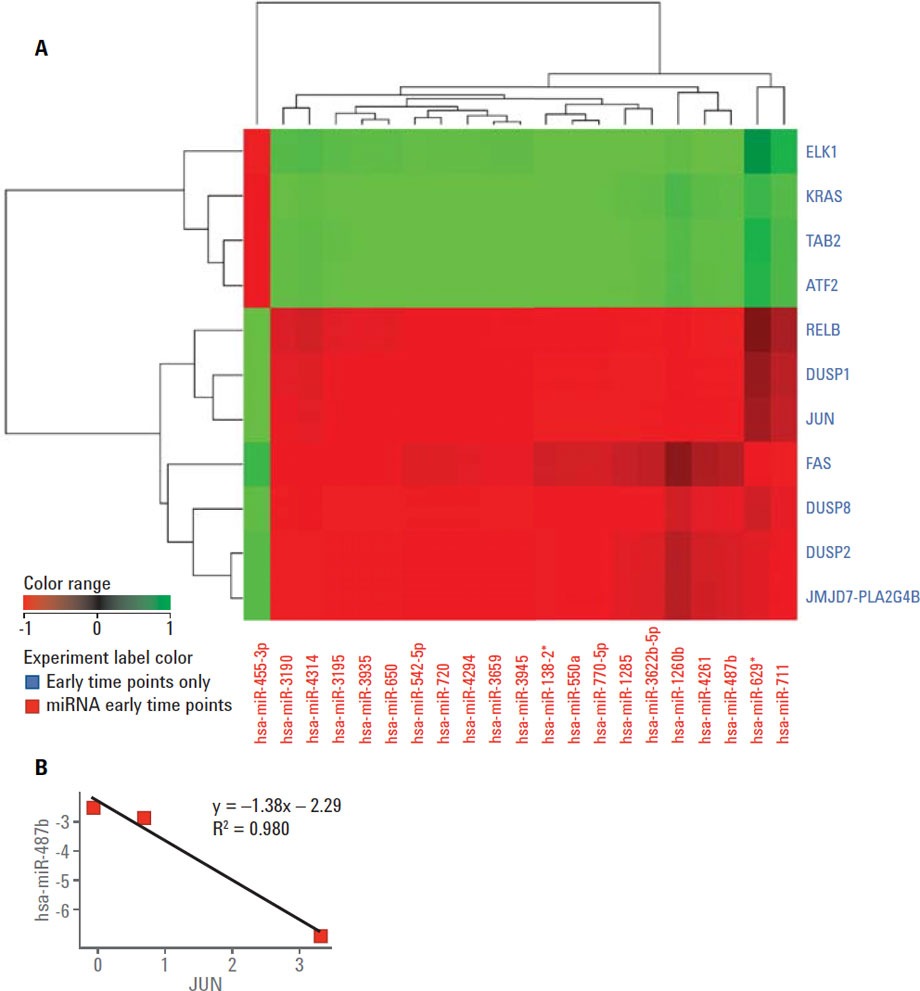
Figure 2. A) Correlation analysis showing the correlation pattern between differentially expressed MAPK mRNAs and miRNAs differentially expressed at four hours. B) Scatter plot showing the relationship between JUN and hsa-miR-487b.
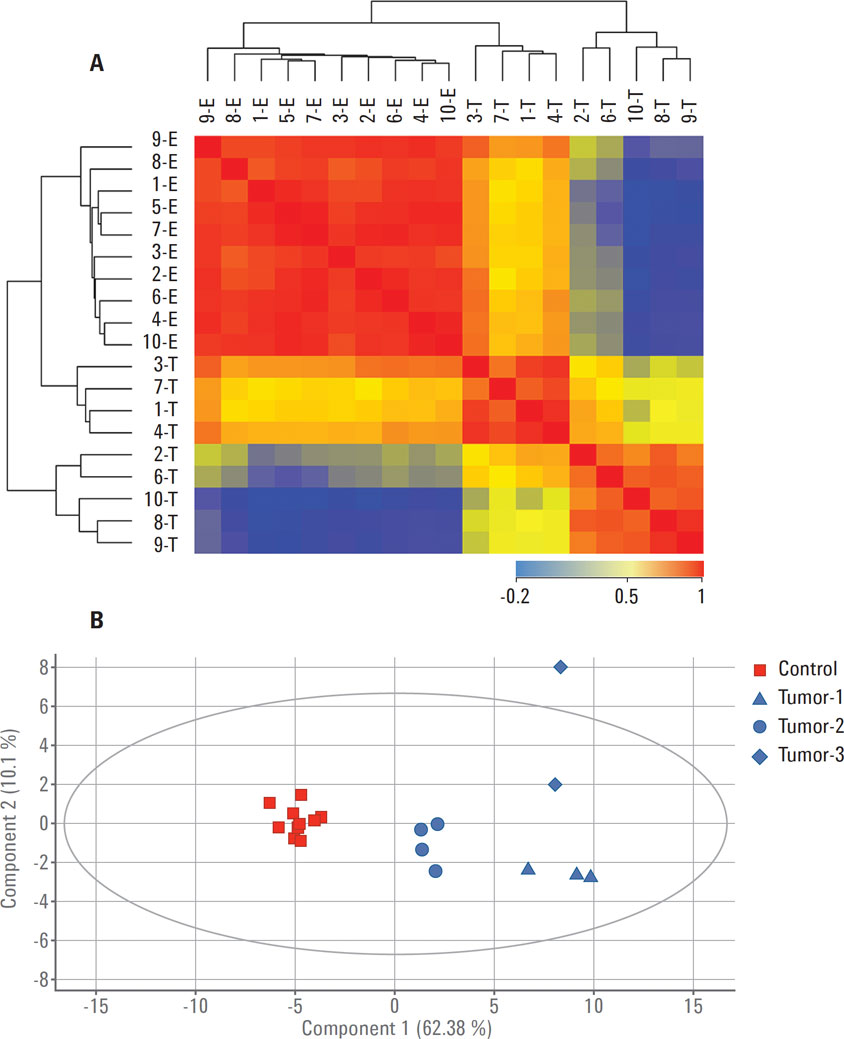
Figure 3. Separation between control (E) and tumor (T) samples based on the 54 proteins identified using a translation of gene signatures from the TCGA mRNA expression experiment in Agilent GeneSpring. A) Sample-sample correlation; B) PCA.
Correlation analysis shows gene expression dependency on miRNA
The functional role of miRNAs often leads to decreased levels of targeted mRNAs and resulting proteins. Thus one would expect to identify anticorrelation relationships between the miRNA levels and the putative mRNA target gene. This offers an extra level of filtering in addition to differential expression analysis and sequence-based miRNA target predictions (also available in GeneSpring platform).
A time course gene expression dataset including mRNA and miRNA using Agilent microarrays of SRL-treated and untreated HT29 cells was used for multi-omic analysis (MOA) using the correlation tool. Agilent GeneSpring/MPP enables investigators to perform correlation analysis among the entities of two experiments performed by two different technologies including mRNA/miRNA pairing. Figure 2A shows a correlation heat map of differentially expressed miRNAs and differentially expressed MAPK genes at four hours post-SRL treatment. The correlation coefficient scatter plot shown in Figure 2B shows the dependency of the expression of JUN and hsa-miR-487b. This correlation suggests that JUN is a putative target of miR-487b miRNA.
Identification of genes and protein core signatures in Glioblastoma Multiforme (GBM)
GeneSpring supports analysis across several different omics measurements, for example, gene expression and proteomics datasets. GBMs are brain tumors that were poorly classified before genomic profiling. For this study, publically available microarray-based gene expression data was obtained from The Cancer Genome Atlas (TCGA). This gene expression data was imported into Agilent GeneSpring to provide a genomic signature to guide the analysis of a small proteomics study of GBM samples. Comparing genomics and proteomics datasets in the GeneSpring/MPP correlation framework led to the identification of a core signature of 54 genes and proteins (Figure 3) [2]. The core signature demonstrated classification power comparable to both the 840 genes and the 587 proteins, highlighting the power of multi-omics data analysis in Agilent GeneSpring. These observations suggest that the heterogeneity of GBM tumors could be best characterized by both mRNA and protein abundance of the signature genes. These findings open up the possibility for follow‑up studies using this integrated approach.
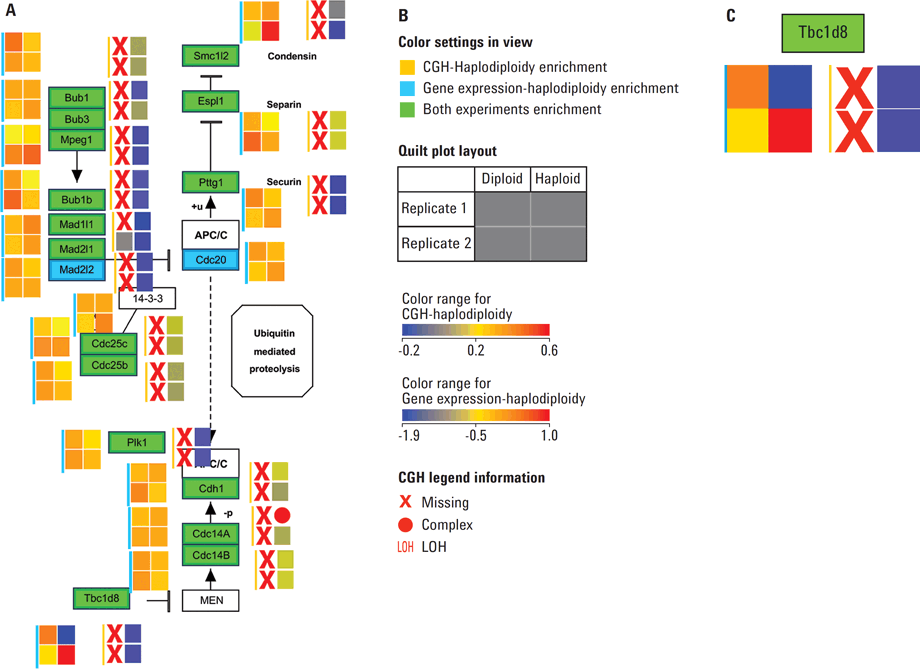
Figure 4. A) Mitotic phase of Cell Cycle pathway, WP190_81191 from the Wiki Pathways portal showing the aberrations and expression levels from spontaneous diploidization studies in mouse cell lines. B) Legends explaining the various color settings required to read the data overlay on the pathway. Quilt plots representing the available data for the expression experiment are marked with a cyan color bar and quilt plots for the CGH experiment are indicated with a deep yellow bar. C) Enlarged section of the pathway in A. Gene Tbc1d8 shows no aberrations and exhibits median expression in both diploid replicates; replicate 1 of haploid state shows low expression and a deletion while replicate 2 of haploid state exhibits high expression (shown in deep red) despite the deletion of a copy of the gene.
GeneSpring’s data integration capabilities extended to copy number data
The Comparative Genomic Hybridization (CGH) workflow in Agilent GeneSpring GX enables scientists to perform integrated analysis of a CGH data with gene expression data. This workflow has been designed to take Average CGH Log Ratios (Average CGHLR) and Loss of Heterozygosity (LOH) scores from Agilent Cytogenomics software or Agilent Genomic Workbench (AGW) reports. The workflow then facilitates data visualization, biological contextualization, and multi-omic analysis. To demonstrate this capability, CGH and mouse gene expression microarray datasets from the NCBI Gene Expression Omnibus (GEO) was imported into GeneSpring GX for integrated analysis. This study describes the effects of the Wee1 inhibitor (PD166285) on parthenogenetic haploid ES cells (phESCs) derived from C57BL/6 or BDF1 F1 hybrid mice and a comparison to mouse embryonic stem cells (mESCs) [3]. Integration of copy number aberration information with that of expression profiles is made easy in Agilent GeneSpring GX using the annotation-rich experiments. This data can be easily integrated using Data Integration Methods such as curated pathways and literature-derived networks. The data overlay in pathways enables the comprehensive visualization of complex variations in the form of heatmaps, heat-strips, and quilt plots (see Figure 4 A—C).
Agilent GeneSpring software enables easy integration of complex datasets
We have shown three examples of how Agilent GeneSpring software enables bench scientists to complement more traditional bioinformatics analysis with correlation tools, and specialized visualizations of pathways. These tools allow researchers to identify coregulated genes, metabolites, and proteins in an intuitive and easy-to-use manner. For more examples and related materials, contact your Agilent representative today.
For Research Use Only. Not for use in diagnostic procedures.
References
- Gene Expression and miRNA Study to Understand Signaling Pathways Inducing Apoptosis in Human Colon Cancer HT29 Cells, Agilent Technologies, Application Note, publication number 5991-6377EN, (2016).
- Molecular Subtypes in Glioblastoma Multiforme: Integrated Analysis Using Agilent GeneSpring and Mass Profiler Professional Multi-Omics Software, Agilent Technologies, Application Note, publication number 5991-5505EN, (2016).
- Working with CGH data in Agilent GeneSpring GX, Agilent Technologies, Technical Overview, publication number 5991-7289EN (2016).
Stay informed about the applications that are important to you
Subscribe to Access Agilent
Our free customized
monthly eNewsletter
Article Directory – September 2016
All articles in this issue
 High-resolution, efficient quantification of aggregates in protein therapeutics with Agilent 1290 Infinity II 2D-LC Solution
 Fast determination of bitter, clove-like flavor in beer with the Agilent 1290 Infinity II LC
 Direct heating delivers a new paradigm in gas chromatography analysis
 Implementing an extractable and leachable (E&L) study from a pharmaceutical product by high resolution QTOF LC-MS
 Multi-omic analysis helps researchers to integrate complex omics data in cancer research
 Gain control—Agilent 490-PRO Micro GC optimizes process monitoring
Figure 1
The MAPK signaling pathway at four hours post-SRL treatment. Yellow boxes indicate that transcripts were differentially expressed. The heat strips next to each entity illustrate gene expression levels for each time point.
Figure 2
A) Correlation analysis showing the correlation pattern between differentially expressed MAPK mRNAs and miRNAs differentially expressed at four hours. B) Scatter plot showing the relationship between JUN and hsa-miR-487b.
Figure 3
Separation between control (E) and tumor (T) samples based on the 54 proteins identified using a translation of gene signatures from the TCGA mRNA expression experiment in Agilent GeneSpring. A) Sample-sample correlation; B) PCA.
Figure 4
A) Mitotic phase of Cell Cycle pathway, WP190_81191 from the Wiki Pathways portal showing the aberrations and expression levels from spontaneous diploidization studies in mouse cell lines. B) Legends explaining the various color settings required to read the data overlay on the pathway. Quilt plots representing the available data for the expression experiment are marked with a cyan color bar and quilt plots for the CGH experiment are indicated with a deep yellow bar. C) Enlarged section of the pathway in A. Gene Tbc1d8 shows no aberrations and exhibits median expression in both diploid replicates; replicate 1 of haploid state shows low expression and a deletion while replicate 2 of haploid state exhibits high expression (shown in deep red) despite the deletion of a copy of the gene.