Ensure that your lab personnel have the tools they need to interpret data quickly and deliver accurate, consistent results fast. OpenLab CDS comes standard with these data analysis tools:

Visualization tools
that allow quick assessment of data to identify out-of-spec data or data that requires further inquiry.

Peak assessment tools
that allow lab staff to quickly assess whether a peak contains one compound or multiple compounds.

Application-specific tools
that address a range of specialized analytical methods.

Additionally, OpenLab CDS provides data analysis tools for method development to automate and accelerate the review process.
See for yourself how OpenLab CDS helps you interpret data and deliver results like a pro.
Visualization Tools|Peak Assessment Tools|Application-Specific Tools
Visualization Tools
Quickly assess your data with graphical views that facilitate drawing conclusions and making decisions.
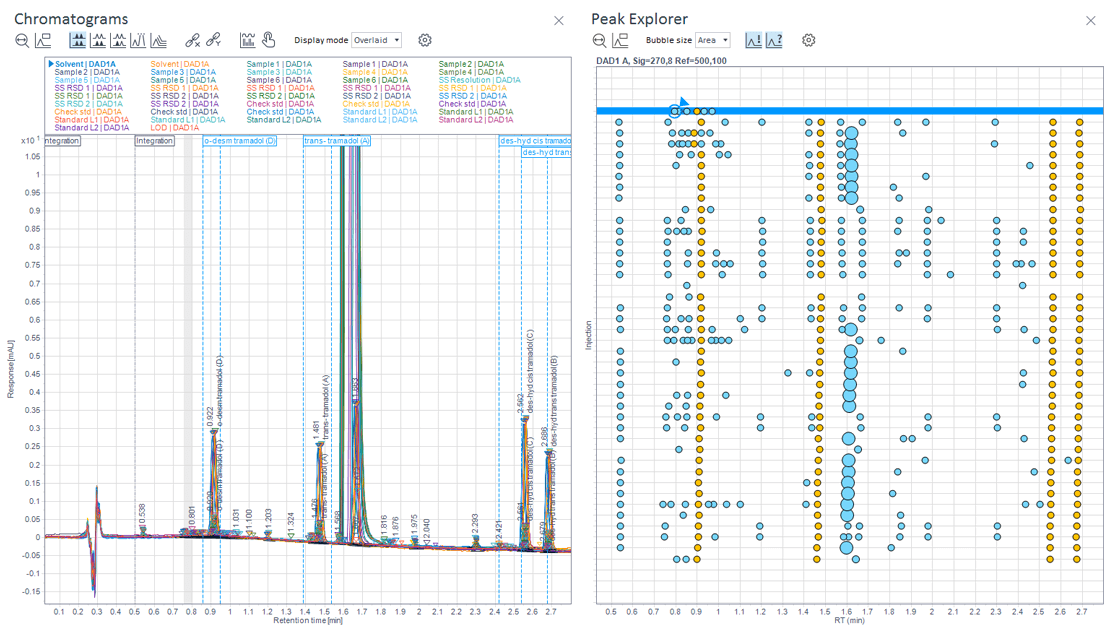
Peak Explorer
Presents a multi-dimensional bubble-chart view of a complex data set, allowing you to easily spot trends, unexpected or missing peaks, retention time shifts, integration problems, outliers, or artifacts in large data sets.
- Compare many chromatograms in a single view
- Visually identify outliers or injections that appear different
- Suitable for visually identifying injections of concern in large data sets
Learn more about Peak Explorer for OpenLab CDS.
Reference Chromatogram
Reference chromatogram and conditional formatting allow lab staff to quickly identify samples that are out-of-spec by visual comparison to a reference or standard sample in a standard chromatographic plot.
- Compare one chromatogram at a time to standard chromatograms during or post run.
- Visually confirm test chromatograms against a standard within your run or imported from previous run.
- Suitable for simple comparisons, capturing large deviations, supporting quick checks, and evaluating smaller data sets.
- Reference chromatograms can be overlayed onto the Online Signal plots for viewing during the acquisition of an injection.
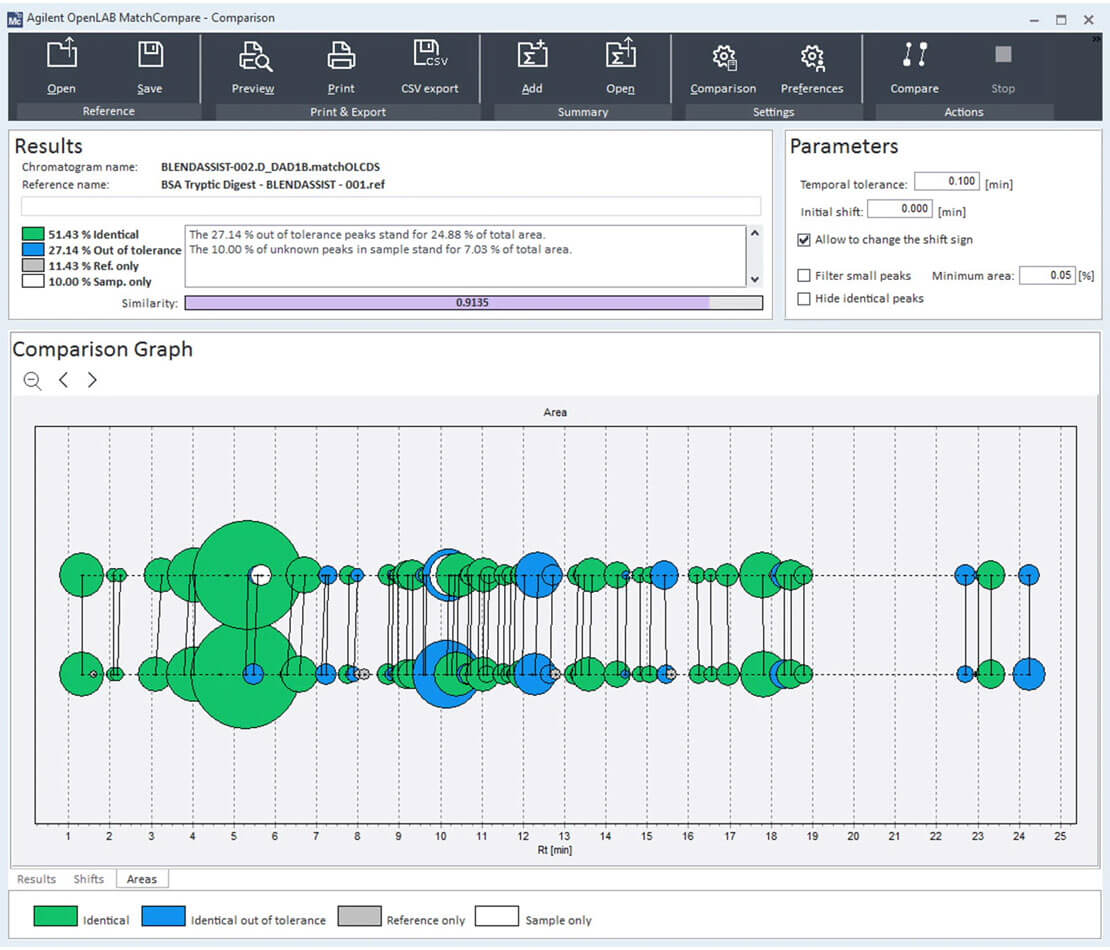
Match Compare
Match Compare for OpenLab provides the ability to objectively compare unknown samples to a known standard based on user defined constraints.
- Comparison of a standard or representative sample to a tested sample based on peak area retention time.
- Tolerances can be adjusted / customized.
- Generates a table that represents the analysis and how well the sample matches the expectations.
- Add-on software requires additional purchase.
Learn more about Match Compare for OpenLab.
Watch the Match Compare video.
More Visualization Tools
Less Visualization Tools
Peak Assessment Tools
Quickly assess peak parameters, whether a peak is pure or contains multiple compounds.
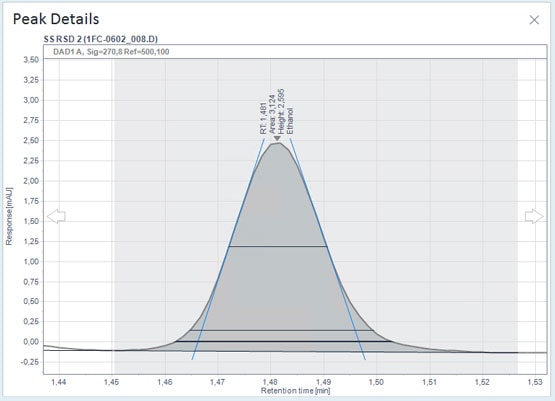
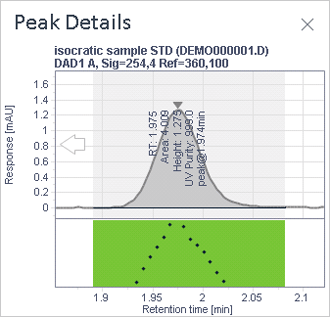
Peak Details
Peak Details lets you zoom in on a selected peak and see details such as retention time and area.
- Dedicated window within the software allows the user to focus on individual peaks.
- Contains precise retention time, area, height, and purity information if relevant for your data.
- Can better assess peak shape because it provides a quick zoom-in on the peak.
- Presents scaled aligned purity ratio curve if relevant to your data.
- Shows the tangents and peak widths in the peak details if you have calculated System Suitability values.
- Allows you to customize peak annotations to support your unique needs.
To learn more, watch the Peak Details tutorial.
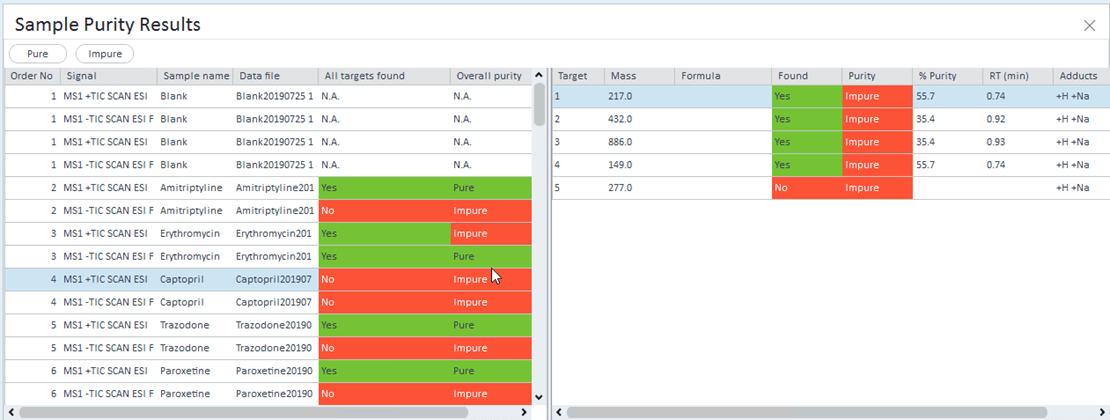
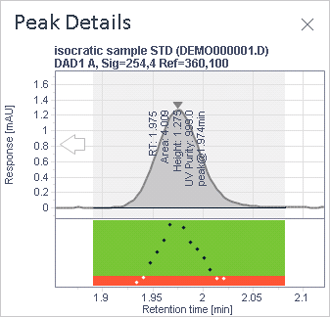
Sample Purity Table with all signals displayed
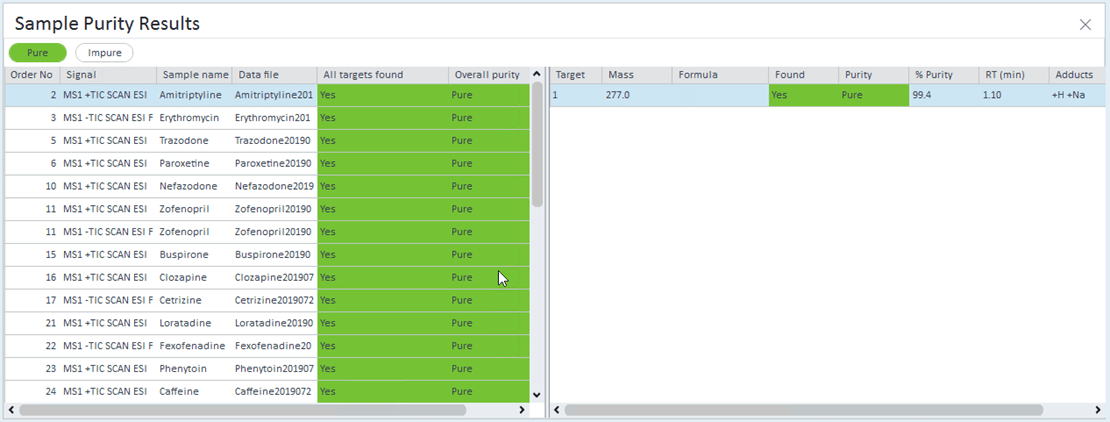
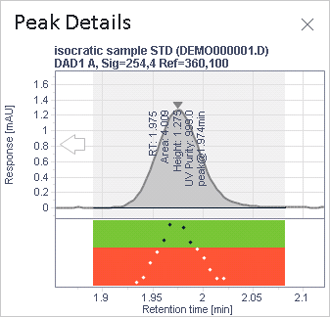
Sample Purity Table with only pure signals displayed
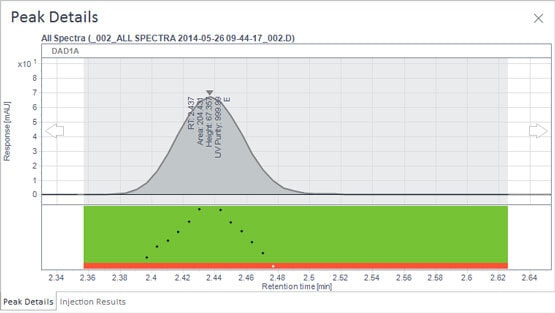
Sample Purity Table (for mass spectrometry only)
OpenLab CDS version 2.6 and above features a new user interface and other useability improvements designed to expedite screening of results, including an algorithm to make calls of pure or impure based on all target signals.
To learn more, read the Sample Purity application note.
Peak Purity Analysis
Automatically flag peaks that have spectra changes across the peak. Provides a tool to calculate and provide values to establish level of purity, based on specific user defined MS or UV spectra purity.
Mass Spectrometry Peak Purity
Apply user-defined thresholds for peak purity to automatically flag peaks that do not meet the chosen purity specification. Review extracted ion chromatograms in just a few clicks to evaluate the nature of the components contributing to that chromatographic peak.
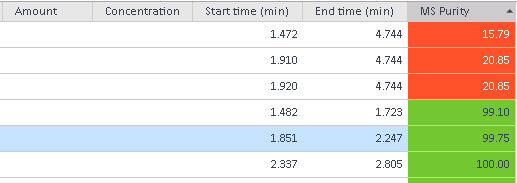
Low sensitivity —
this peak is considered pure
Default sensitivity —
this peak is considered impure
High sensitivity —
this peak is considered impure
UV impurity check (Diode array) or UV Peak Purity: For specific signal purity assessment. The software has default values on the sensitivity of this algorithm which can be modified by the user.
- User defines wavelength of interest.
- Software calculates purity based on “difference of signal trace” of other wavelengths.
- Based on chosen wavelength, will perform standard peak purity analysis.
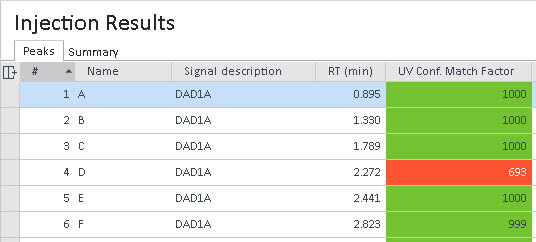
UV Spectrum Confirmation
Automatically assess spectra in your analysis against a reference spectra stored in the processing method to flag unexpected results.
UV Reference Spectrum
- Algorithm checks spectra against expected spectra.
- Stores one spectra per compound in the method.
- Confirms match and flags mismatch.
- User may adjust tolerances in the algorithm.
- Provides a comparison view so you can visually inspect comparison sample spectrum to expected spectrum.
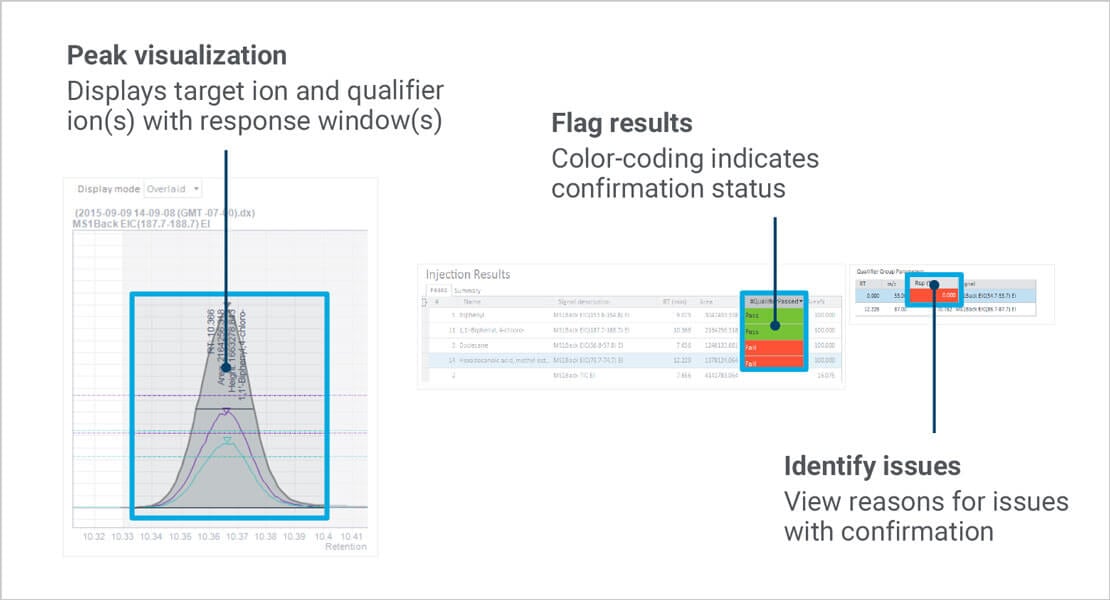
Mass Spectrometry Compound Confirmation
Automatically assess spectra in your analysis against a spectral library of your choosing to positively identify expected ions and flag unexpected ions.
- Algorithm checks spectra against expected spectra.
- Identifies match against library.
- Identifies match with qualifier ion(s).
- Supports custom libraries and imported NIST libraries.
- User may adjust tolerances in the algorithm.
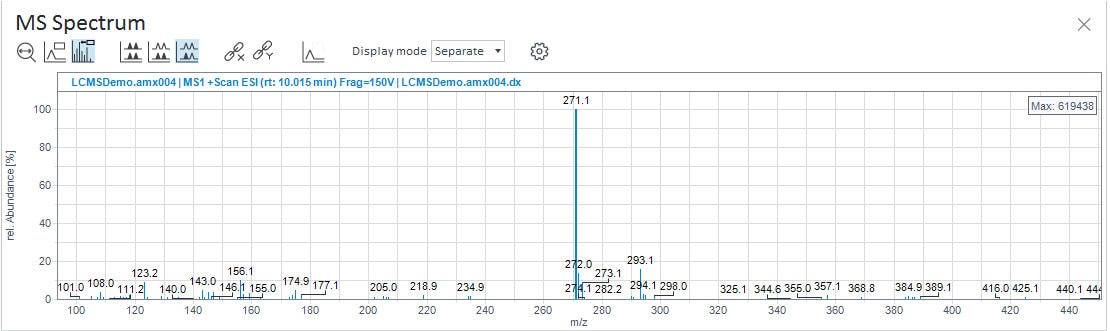
MS Spectrum Window
Quickly assess Mass Spectra at the peak level to qualitatively assess results.
- Allows you to evaluate peak composition—review peak data in the spectrum window.
- MS spectrum window key capabilities:
- Identify or verify the base peak (main m/z of interest).
- Right-click and view the spectra of peak and review (usually to ID base peak or confirm base peak, but there are many applications).
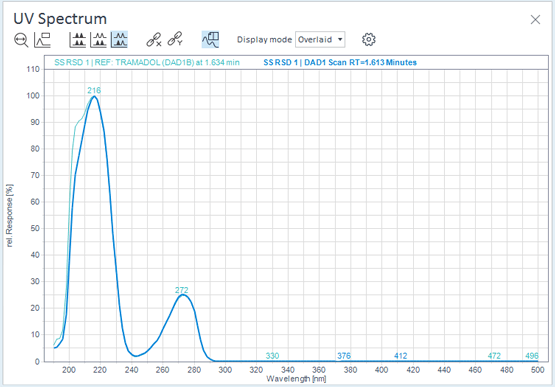
UV Spectrum Window
Allows you to click on a compound or peak and extract spectra and review data.
- Customizable interface and spectra review.
- Spectra can be overlaid or separated; reference spectra can be added as well.
- With algorithms discussed in peak purity or reference spectrum, user can use more advanced workflows.
More Peak Assessment Tools
Less Peak Assessment Tools
Application-Specific Tools
Easily extend functionality or add additional capabilities to OpenLab CDS with application-specific software add-ons.
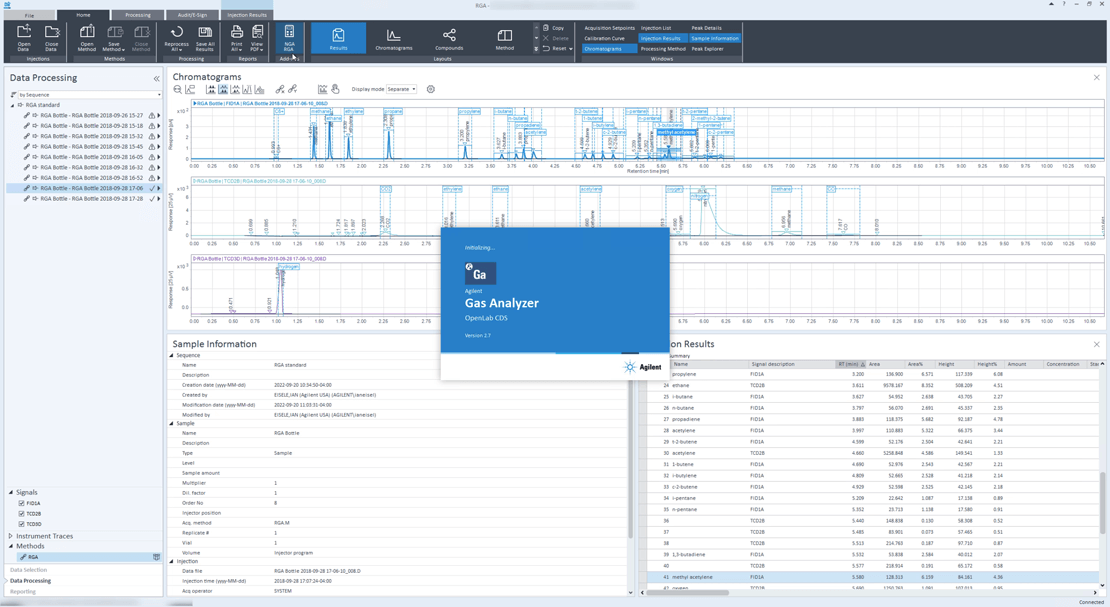
RGA/NGA
Supports Refinery Gas Analysis / Natural Gas Analysis (RGA/NGA) to make common calculations easy for producers of refinery gas and natural gas by calculating energy content in the refined material or material produced at the well.
- Loading this no-cost add-on to OpenLab CDS will update the software to support RGA/NGA analysis by adding:
- A new report template
- New custom calculations
- New constants (values for reports and the custom calculator)
- Supports both English units with the energy content being primarily reported in BTUs and Metric units with energy content reported in kJ or Wobbe Index.
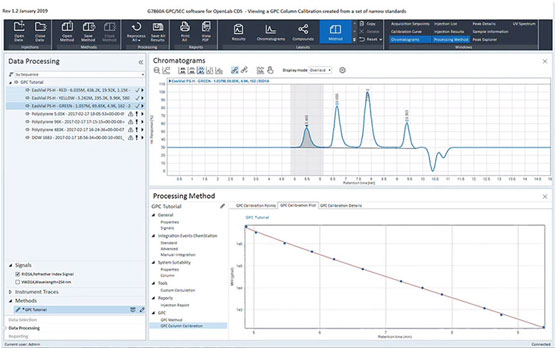
GPC/SEC
Gel Permeation Chromatography / Size-Exclusion Chromatography (GPC/SEC) software enables you to separate compounds by molecular weight and supports dedicated calculations and values, including:
- Molecular weight evaluation, measurement.
- Molecular weight standards and regression algorithm for calculating molecular weight of compounds being evaluated against standards run in the same analysis (basically plotting unknowns on a standard curve except the regression is not linear).
- Add-on software requires additional purchase.
Learn more about GPC/SEC Software for OpenLab CDS.
Mass Spectrometry Tools
Auto Compound creation will automatically add compounds to the compound table – one for each peak in the current data set:
- Advantage is that you do not have to create the table so much, but you may have to rename the compounds.
- Links to NIST and may automatically annotate compounds for you.
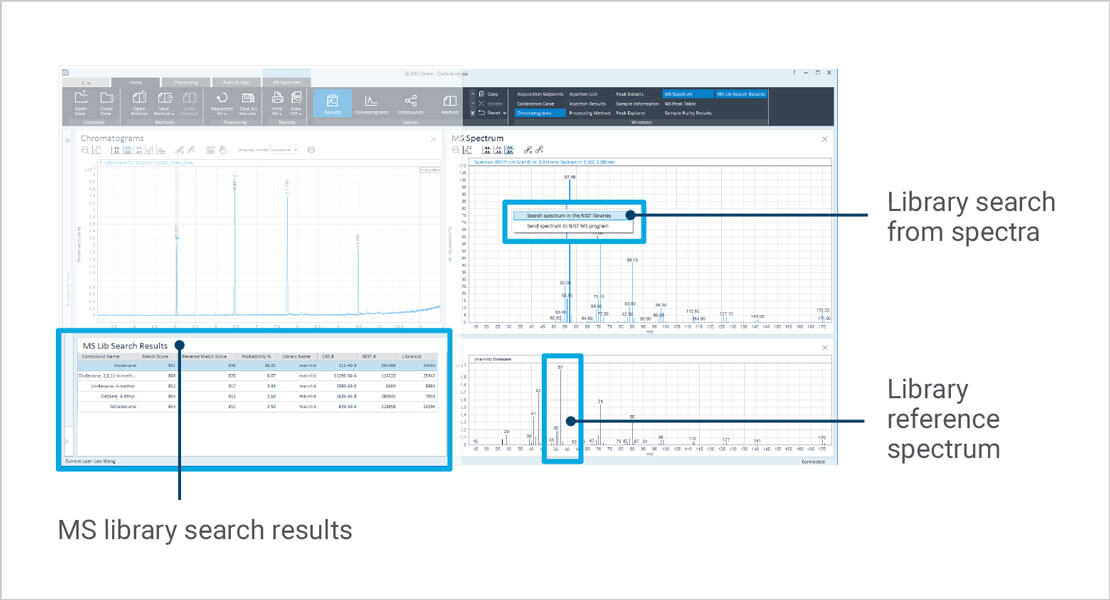
Library Searching
- Compares spectrum in your analysis (currently loaded data) to spectrum library.
- Identifies compound based on the match to spectrum in the library—a database of compounds and the spectra (pattern/mass profile) associated with them.
Learn more about Mass Spectrometry features in OpenLab CDS.
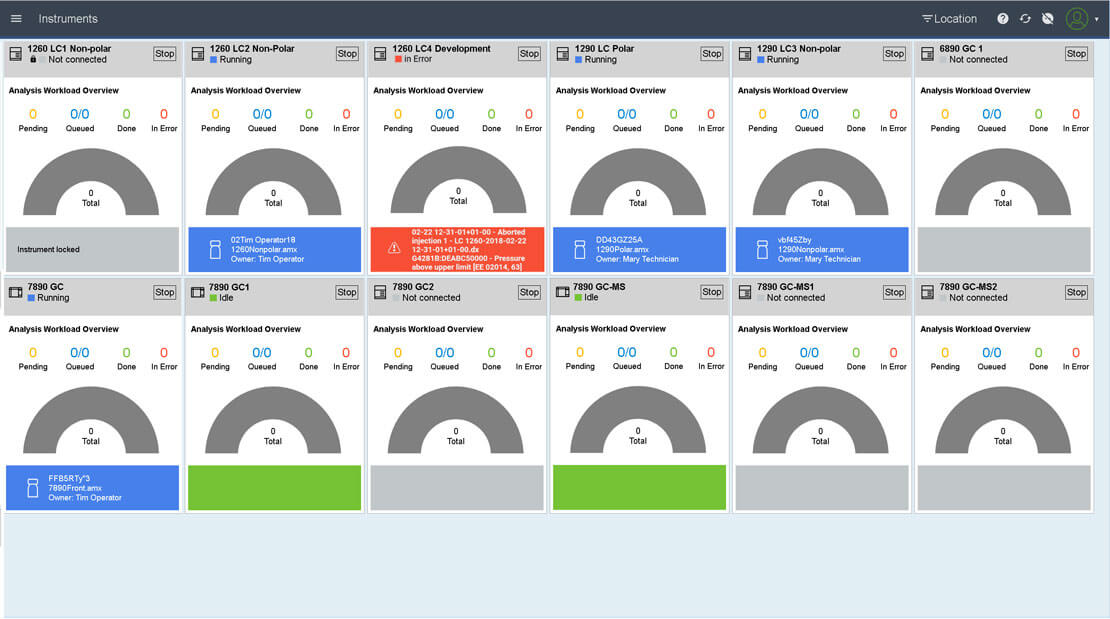
Sample Scheduler
Sample Scheduler for OpenLab provides a simple interface to manage your workload and speed up instrument operation. Automates the scheduling and assignment of samples, greatly reducing errors caused by manual transcription.
- Submit samples and manage instruments across the lab.
- Provides a lab-wide view of instruments and samples in process – from your desktop, tablet, or mobile phone.
- Automate the transfer of all relevant sample information and results between your LIMS and CDS.
- Add-on software requires additional purchase.
Learn more about Sample Scheduler for OpenLab.