
As your lab processes ever-larger numbers of samples, you need faster, smarter ways to navigate and visualize results.
Peak Explorer, an integral part of OpenLab CDS, makes it easy to quickly review large data sets and identify samples of interest, outliers, and artifacts. Now you can increase productivity, remediate problems with maximum efficiency, and be confident in your lab’s results.

Benefits of Peak Explorer
-

Speed
Boosts sample throughput for analytical labs processing large numbers of complex samples. -

Flexibility
Provides the analyst with more detailed information about a specific peak or selected injection by simply clicking on a specific bubble. -

Simplicity
Easy to find additional peaks, missing peaks, and peaks not correctly identified within seconds by comparing the patterns of chromatograms across all injections. -

Accuracy
Automatically displays the zoomed peak in outliers, so integration problems can be resolved easily by changing the integration parameters in the processing method or by manually adjusting the peak integration.
Powerful peak integration, exploration, and processing
With complex mixtures, even the best chromatography cannot fully separate all unique components every time. That’s why OpenLab CDS features embedded mathematical and graphical display algorithms that help you resolve, find, and process these mixtures.
OpenLab CDS also lets you choose between multiple integrators, which can be configured to make sure chromatograms
are integrated correctly the first time. That means existing OpenLab CDS ChemStation or EZChrom Edition users can rest assured that the results generated today will be consistent with those from the past.
Occasionally, a peak will appear that requires manual integration. These peaks can easily be addressed using the context-sensitive manual integration capability of OpenLab CDS. Simply move the cursor to your area of interest, and the correct integration tool will be activated automatically. If more than one integration tool is applicable, an integration wheel
displaying each tool makes selection easy.
Want to correct a baseline? Just move the leading or trailing point. Want to integrate an overlooked peak? Simply add the baseline. Results are automatically generated and displayed after each operation. Manual integration events can also be incorporated into your data analysis method to increase your speed to results.
Visualize the advantages
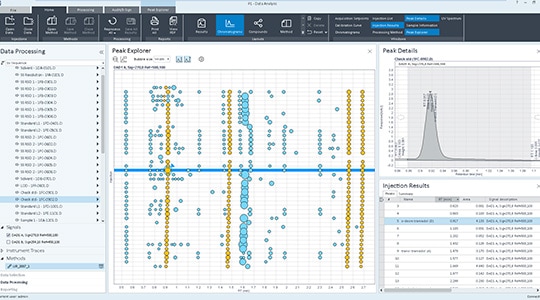
Sometimes a picture is worth a thousand words. Peak Explorer presents a multi-dimensional “bubble chart” view of a complex data set, allowing you to easily spot trends, unexpected or missing peaks, retention time shifts, integration problems, outliers, or artifacts.
For example, Peak Explorer can help you diagnose instrument problems quickly by visualizing retention time trends for a single compound over a series of injections. With LC systems, earlier elution times may suggest solvent mixing problems, later elution times indicate improper column equilibration, and random elution times signal air in the pump.
The unique combination of speed, flexibility, simplicity, accuracy, and cost savings makes Peak Explorer an important addition to your lab’s data review process.
Additional resources
Ready to get started?
Whether your needs are simple or complex, OpenLab Software can raise productivity and improve work quality simultaneously. Contact us to discuss your specific requirements and goals.
Contact us