Access Agilent eNewsletter February 2015
>> Update My Profile | Subscribe to Access Agilent | Article Directory
Improved analysis of pesticides and optimized sample prep with Agilent QuEChERS miniaturization and 7010 Triple Quadrupole GC/MS
By Melissa Churley and Joan Stevens
Agilent Senior Applications Scientists
Improved sample prep for advanced analysis of pesticides is a priority for food safety. To address this need, Agilent combined miniaturized QuEChERS and the Ultra-Efficient Ionization source of the Agilent 7010 Triple Quadrupole GC/MS – which reduces sample injection by 75% – for optimized sample prep and rugged analysis of pesticides in food.
Miniaturizing sample preparation has several advantages:
- Using less solvent means reduced solvent cost and waste.
- Smaller sample sizes are easier to handle, store, and process in the lab.
- Sample preparation sorbent and labeled compounds used as internal standards cost less.
- Smaller sample sizes allow you to use additional labeled compounds for troublesome analytes that are cost prohibitive with larger sample sizes.
In the following example, Agilent’s miniaturized QuEChERS system reached limits of quantitation ≤ 10 ng/g for over 95% of 126 pesticides in apple, carrot, and broccoli. Injecting only 25% of the standard injection volume, pesticides were analyzed at or below the 10 ng/g MRL threshold (as described by the US EPA, EU, and Japan as adequate to monitor exposure). We show that less matrix injected prolongs uptime and sustains performance, resulting in lower maintenance costs.
Using scaled-down QuEChERS to investigate the extraction of pesticides
In our analysis, two grams of homogenized sample (apple, carrot, or broccoli) were weighed into a 15 mL centrifuge tube with two ceramic homogenizers. QC samples were fortified with 1 µg/mL pesticide stock solution (126 pesticides) yielding QC samples of 5, 10, and 50 ng/g. Internal standard spiking solution (10 µL of 10 µg/mL parathion-d10, DDT, p,p-13C12, TPP ) was added to all samples except the control blank, to yield a 50 ng/g concentration in each sample. One percent acetic acid in acetonitrile (2 mL) was then added to each tube. They were capped and vortexed for 1 minute, then 1 g of Agilent AOAC QuEChERS salts was added. Finally, the tubes were sealed and vigorously shaken for 1 minute, then centrifuged at 4,000 rpm for 5 minutes. A 1 mL aliquot of the upper ACN layer from the extracts was transferred to an Agilent QuEChERS dispersive SPE 2 mL tube. For apple extracts Agilent QuEChERS AOAC dispersive SPE containing 50 mg PSA, 150 mg MgSO4 was used. For broccoli and carrot Agilent QuEChERS EN dispersive SPE containing 25 mg PSA, 2.5 mg GCB, 150 mg MgSO4 was used. For complete details of this test, read Application Notes 5990-1054EN and 5990-5507EN.
 Enlarge
Figure 1. Distribution of % RSD for 126 pesticides in apple, carrot, and broccoli extract at 1 and 5 ng/g using 0.5 µL injection (n=6).
 Enlarge
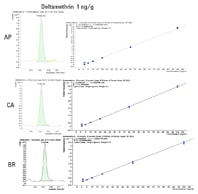
Figure 2. Correlation coefficient (R2) and quantitative transition (MRM) for deltamethrin spiked at 1 ng/g in apple (AP), carrot (CA), and broccoli (BR).
 Enlarge
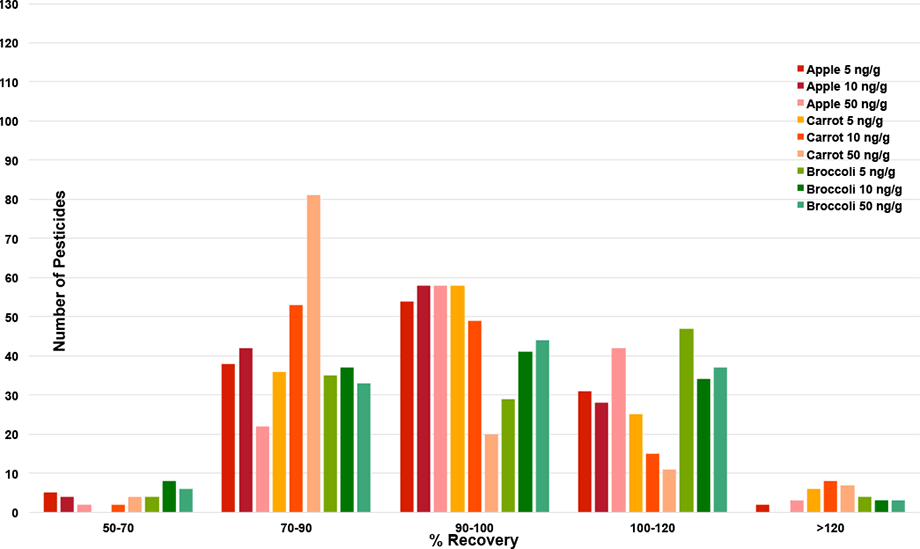
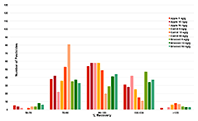
Figure 3. Distribution of recovery for 126 pesticides from pre-extraction spiked apples, carrots, and broccoli using 0.5 µL injection of 5, 10, and 50 ng/g level extracts.
 Enlarge
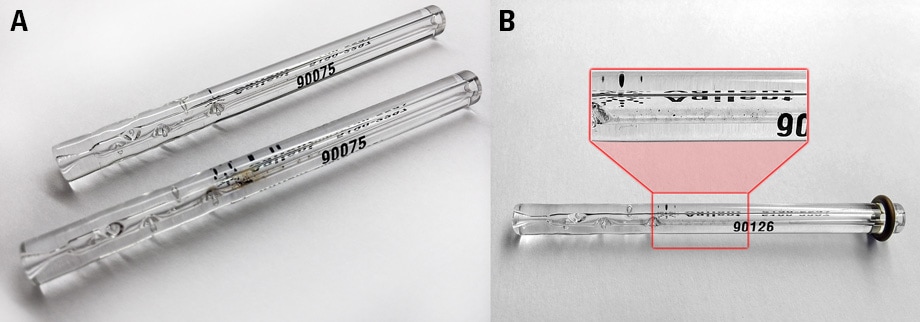
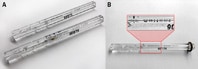
Figure 4. GC liners (A) residue deposit after 65 injections of 0.5 µL (upper) and 2 µL matrix extract (lower); (B) almost free of visible deposits after 200+ injections of matrix extract of 0.5 µL.
Maximize results with an inert flow path
To continue our analysis, we maximized flow path inertness by using Agilent J&W HP-5ms Ultra Inert GC columns (5 m x 0.25 mm, 0.25 µm and 15 m x 0.25 mm, 0.25 µm (G3903-61005, 19091S-431UI), Agilent Ultra Inert 2 mm dimpled liner, and Agilent UltiMetal Plus Flexible Metal ferrules at the Purged Ultimate Union used for column backflushing.
Calibration standards for a mixture of 126 pesticides and groups of pesticide isomers were prepared by spiking the extracted blank matrix (apple, carrot, and broccoli) at 1 to 100 ng/g. Figure 1 shows the distribution of percentage RSDs for the pesticides in apples, carrots, and broccoli using 0.5 µL injection volume at 1 and 5 ng/g.
Next, sets of six standards were injected six times – consecutively – with calibration on the middle set, using a linear curve fit with 1/x weighting. The other five sets of standards were designated as QCs and appear as blue triangles in Figure 2, to indicate the precision of the method. Calibration sets yielded correlation coefficient values (R2) that were >0.99 on average for 95% of the 126 pesticides spiked in apple, carrot, and broccoli.
Maintaining optimal chromatography with one quarter the injection sample
The amount injected in a 0.5 µL injection was 2.5 pg, a 75% reduction in sample amount compared with 10 pg contained in a standard 2 µL injection volume. Even with this reduction in injected sample, optimal chromatography for some of the most challenging pesticides was maintained at half the default MRL, or 5 ng/g.
Recovery was evaluated by spiking the pesticide standards in comminuted apple, carrot, and broccoli at levels of 5, 10, and 50 ng/g. These QC samples were quantitated against the matrix-spiked calibration curve, with three replicates at each level. The distribution of recovery for 1 mL volume dispersive SPE is shown in Figure 3.
Reduce injection volume to prolong liner performance
In Figure 4 we show GC inlet liners that have had different sample volumes injected. In A, the upper liner had over 65 injections of 0.5 µL sample. The lower liner had a greater amount of the same sample injected, 2.0 µL, also over 65 times and clearly contains increased deposits that reduce usable liner lifetime and added additional maintenance costs. The liner in B had reduced sample volume injected but over 200 injections (0.5 µL). This liner is almost free of visible deposits, shown clearly within the magnified view, which prolongs performance and decreases costs.
Agilent miniaturized QuEChERS for optimized food analysis
Miniaturizing QuEChERS extraction decreases sample preparation costs by 80%, with less solvent and solvent waste, and reduced requirement for labeled compounds. By using an existing analytical method with the Ultra-Efficient Ionization source of the Agilent 7100 Triple Quadrupole GC/MS, over 95% of the pesticide residues analyzed in apple, carrot, and broccoli, were quantitated at or below the default threshold of 10 ng/g.
More examples of Agilent QuEChERS methods are freely available in Agilent Bond Elut QuEChERS Food Safety Applications Notebook: Volume 2. Additionally, our comprehensive GC/MS/MS Pesticide Analysis Reference Guide provides a complete approach for pesticide testing. Contact your Agilent Sales Representative today to get your copy.
>> Update My Profile | Subscribe to Access Agilent | Article Directory
Figure 1.
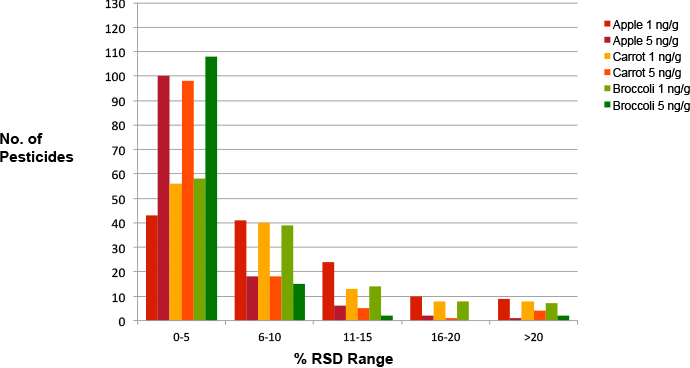
Distribution of % RSD for 126 pesticides in apple, carrot, and broccoli extract at 1 and 5 ng/g using 0.5 µL injection (n=6).
Figure 2.
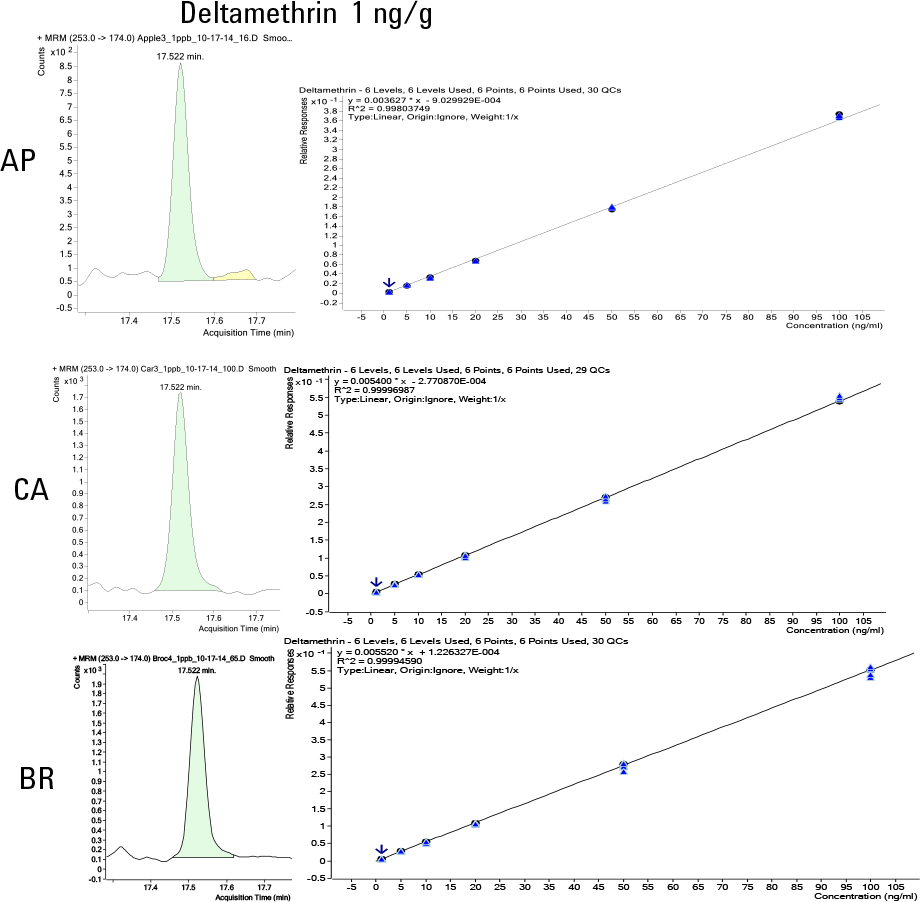
Correlation coefficient (R2) and quantitative transition (MRM) for deltamethrin spiked at 1 ng/g in apple (AP), carrot (CA), and broccoli (BR).