Access Agilent eNewsletter, March 2014
>> Update My Profile | Subscribe to Access Agilent | Article Directory
Three powerful tools to improve GC/MS methods for large numbers of analytes in complex matrices
By Bruce Quimby
Agilent Senior Applications Chemist
GC/MS and GC/MS/MS have become widely used for the analyses of large numbers of analytes in complex matrices. Methods that target more than a hundred analytes are now common for applications such as toxicology, environmental analysis, and pesticides in food. These types of methods yield a large amount of information from each analysis, but they also present challenges.
One challenge is maintenance of retention times in precisely known retention time windows. If analytes drift outside their respective time windows, their presence will be missed, resulting in false negatives. For GC/MS methods in complex or “dirty” matrices, a further challenge is data review. You must examine the target and qualifier ion ratios for each target analyte to determine if the compound is present. In complex matrices, interferences from the matrix ions often result in incorrect qualifier ion ratios. With large numbers of analytes, data review becomes a bottleneck in the workflow of the lab. This article describes three useful techniques to address these challenges.
Retention Time Locking reduces effort to align retention times
Retention Time Locking (RTL) is a technique invented by Agilent to precisely match retention times (RTs) column-to-column and instrument-to-instrument for methods with the same nominal parameters. When you set up the same method on two different instruments with identical parameters, the RTs almost never match, often being different by as much as 0.5 minutes. Experienced analysts have known for years that you can make RTs match by adjusting the column flow, but this trial-and-error process is very time-consuming. Agilent’s RTL technique solves this problem.
 Enlarge
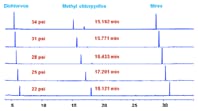
Figure 1. Example of five runs used once per method for RTL calibration. Methyl chlorpyrifos is the locking compound.
RTL is simple to use. Once method development is completed, you choose a locking compound and make five RTL calibration runs, which include runs at inlet pressures 10 percent and 20 percent above and below the nominal method pressure (See Figure 1). The RTL software then uses polynomial regression to construct an equation of pressure as a function of RT for the locking compound in the five calibration runs. You must perform this process only once for a given method. For all subsequent uses of the method, you run the locking compound and use the resulting pressure and RT with the equation to calculate the inlet pressure required to match retention times.
One of the most useful applications of RTL is precisely matching retention times to a previously collected database of RTs and spectra for analytes. That capability allows you to easily manage large screening methods that target, for example, pesticides or toxicology. RTL typically makes the RTs of all analytes match those in the database to within 0.030 minutes or better. The Agilent GC/MS Pesticides Analyzer is based on RTL.
Backflushing removes heavy sample components
Each injection of high-matrix samples can place high-boiling compounds at the head of the column. These heavy materials can move slowly through the column and elute during subsequent runs, causing interferences with analytes. They can also build up near the head of the column and degrade chromatographic performance, which necessitates trimming the column. Baking the column at the end of the run can remove some of the heavy materials, but often requires extended baking times and sends column bleed and heavy matrix components into the ion source of the mass spectrometer. This contamination necessitates more frequent source cleaning and shortens column life. A much better way to eliminate heavy matrix components is to backflush them out of the column so they never reach the detector.
To backflush, after the RT of the last analyte, you reverse the column flow using an auxiliary flow of carrier gas. Auxiliary gas control modules and Capillary Flow Technology (CFT) connection devices are available for Agilent’s GCs to easily incorporate backflushing into GC/MS methods.
 Enlarge
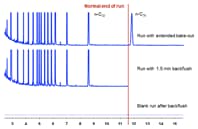
Figure 2. Heavy matrix components are removed with backflushing instead of extended column bake-out.
Figure 2 shows a GC/MS method with post-column backflushing. In this example, n-C36 alkane elutes after the normal end of the run (11.6 min), as seen in the top chromatogram. The middle chromatogram shows the same sample, but the run is stopped and backflushed for 1.5 minutes at the final oven temperature. The bottom chromatogram is a blank run immediately after the backflush run. It shows that the n-C36 peak was completely removed by the backflushing process.
During backflush, the heaviest materials elute first from the head of the column, because they are the compounds that traveled the least distance into the column. Once you determine the correct backflushing time for a method, removal of heavy materials from the column is ensured. Because of all the benefits provided by backflushing, the technique is incorporated into all Agilent GC/MS and GC/MS/MS based analyzers, including the Agilent GC/MS/MS PAH Analyzer.
Deconvolution Reporting Software speeds review of complex data
Many GC/MS methods require analysis with electron impact (EI) scan mode. This mode allows you to quantitate targets with extracted ion chromatograms (EICs) and identify unknown nontargets by library search of spectra. As an example, this approach is often used in forensic/toxicology applications.
For large screening methods with hundreds of targets, especially those with complex matrices, data review becomes very challenging. You must evaluate the target and qualifier ion ratios for each target analyte to determine if the compound is present. In complex matrices like blood, interferences from the matrix ions often result in incorrect qualifier ion ratios for analytes. To address this problem, Agilent developed Deconvolution Reporting Software (DRS).
In DRS, you first deconvolute the scan file to obtain spectra cleaned of interferences for every peak in the chromatogram. Deconvolution is based on the idea that as a compound moves through the detector (MS), a chromatographic peak appears at that retention time at all m/z values in the mass spectrum of that compound. The deconvolution software inspects EICs of each mass in the data file over the entire time range of the run. It compares the chromatographic peaks at a given RT for each mass to see if they have exactly the same apex retention time and the same peak shape. If they do, then they are assumed to be from the same compound.
The mass and height of each EIC that meets the criteria are then used to construct the deconvoluted spectrum. The NIST AMDIS deconvolution software used in DRS has advanced algorithms that can extract the spectra from peaks that are separated by as little as one scan.
 Enlarge
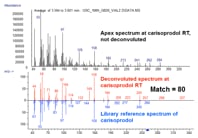
Figure 3. Deconvolution aids spectral confirmation of carisoprodol in a blood extract with high levels of interfering fatty acids.
Figure 3 (top) shows the apex spectrum at the RT of carisoprodol in a blood extract before deconvolution. When searched against the NIST library, the top hit was oleic acid and carisoprodol did not appear in the top 100 hits. The bottom of Figure 3 shows the deconvoluted spectrum. Now with the interferences removed by AMDIS, the spectrum matches carisoprodol in the NIST library with a match quality of 80 and is the top hit.
Once deconvolution is complete, for all peaks found in the scan file, the cleaned spectrum is searched against a target library. If the spectrum of a peak matches that of a target better than a user-defined minimum and if the RT of the peak precisely matches that in the target library, then the compound is reported present. This entire process typically takes less than two minutes. By using the combination of precise RT matching and deconvoluted full spectra, the identification of targets is much faster and more reliable. Because you use all of the ions in the spectrum instead of a target and a few qualifiers, you minimize the effects of interferences. In practice, the data reviewer inspects each reported target, quantifies it if desired, and prints the final report.
Improved GC/MS methods with Agilent’s powerful timesaving tools
The three powerful tools described here can save analysts considerable time in method maintenance and data review. For a faster route to more reliable results when you screen large numbers of targets, Agilent offers a family of GC/MS EI scan mode analyzers that are preconfigured with these three tools – RTL, backflushing, and DRS. Finding your workload is increasing? Why not explore Agilent’s analyzers today.
>> Update My Profile | Subscribe to Access Agilent | Article Directory