Access Agilent eNewsletter, March 2015
>> Update My Profile | Subscribe to Access Agilent | Article Directory

Agilent FTIR chemical imaging solution delivers fast polymer defect analysis
By Kevin Grant, Mustafa Kansiz
Agilent FTIR Microscopy & Imaging Products
Polymer manufacturers face increased pressure to reduce the duration of production cycles and increase product yields. Fast and reliable quality control and troubleshooting mechanisms help maximize revenue. A minor hiccup in production can have a significant downstream impact and impose a heavy financial burden. In addition, the incredible speed of modern industrial processes, the diversity and complexity of manufactured products, and the need to provide a complete audit trail for regulatory purposes further heighten already demanding quality control needs.
Fourier transform infrared (FTIR) spectroscopy is an established analytical technique in the polymer industry. It can uniquely provide detailed information about the structure, composition, and purity of polymeric materials.
In the following examples, we used the Agilent Cary 620 FTIR chemical imaging system to investigate customer samples. The nondestructive techniques of the 620 FTIR deliver fast results with high sensitivity and high spatial resolution to characterize samples as received. Minimal operator experience or training is required.
 Enlarge
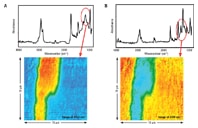
Figure 1. Chemical images and spectra of a polymer film. 1a. Warm colors highlight areas of high absorbance intensities associated with an acryloid. 1b. Regions where intrinsic absorbances associated with the bulk polymer are present (warm colors) or absent (cool colors).
Quick identification of a polymer film defect
We analyzed a customer’s polymer film as received by coupling a 620 FTIR microscope to a Cary 660 FTIR spectrometer. The sample was simply held vertically in a microvice, sectioned with a razor blade to expose the defect, and mounted onto the microscope. No further sample preparation was needed. By simultaneously observing the sample under the microscope and moving the motorized sample stage, the defect was easily and accurately maneuvered under the Ge micro-ATR (attenuated total reflection) accessory.
A single analysis took about 90 seconds to accurately characterize the defect in the polymer, and assess its likely impact on the production cycle (Figure 1). We characterized the precise nature of the anomaly by extracting a spectrum and using Agilent Resolutions Pro FTIR software to compare it automatically with library entries. The compound was a type of acryloid, commonly used as an impact modifier in polymer formulations.
We concluded that the defect arose from extruding a poorly homogenized product. Heterogeneities such as this indicate poorly melted precursors. Full details of this analysis are found in the free Agilent publication 5991-5294EN.
 Enlarge
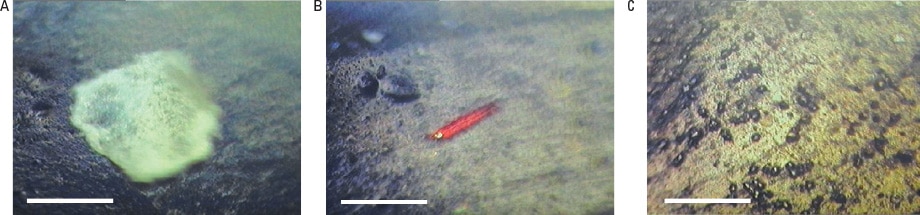
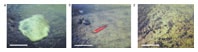
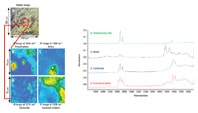
Figure 2. Visible light images of defects in synthetic rubber, collected using the combined 15x visible/IR objective on a Cary 620 FTIR microscope. Scale bar = 200 µm.
Rapidly identify multicontaminants in synthetic rubber
In our analysis of defects in synthetic rubber, the sample was more complex since it contained a range of anomalous objects with highly variable shape and dimensions (Figure 2), and so we used a multifaceted analytical approach. Again, no sample prep was required.
The most easily distinguished defects on the polymer surface were roughly spherical white patches, 50 to 100 µm diameter (Figure 2a). Single point, micro-ATR collected sufficient data in less than 60 seconds to match the spectrum with a polyamide library entry, an intrinsic component of the bulk polymer.
However, single point microanalysis of the red fibrous defects (Figure 2b) was not appropriate, because they were less than 10 µm across and the detector collects all light from the apertured sample area. We therefore switched to the 64 x 64 focal plane array detector, which simultaneously collects 4,096 unique full-range spectra from across the entire analytical region with each measurement. Library matching rapidly identified the red defect as a type of cellulose, probably a cotton fiber from the environment.
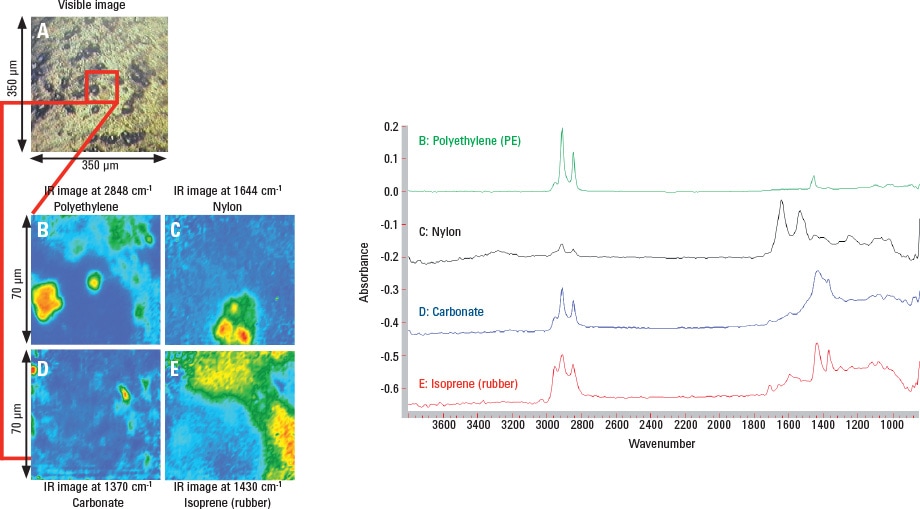
Finally, the bulk polymer was extremely heterogeneous (Figure 2c). A single chemical image collected in under 60 seconds with the Ge micro-ATR slide-on accessory revealed the presence of four distinct chemical components, polyethylene, nylon, carbonate, and the natural isoprene rubber matrix (Figure 3).
Read further details of these comprehensive analyses in Agilent publication 5991-5224EN.
 Enlarge
Figure 3. Visible light (a) and chemical images showing the heterogeneous spatial distribution of defects identified from spectral library searches as, b) polyethylene, c) nylon, d) carbonate and e) isoprene (rubber).
Agilent solutions for effective polymer analysis
Reliable analysis of polymer manufacturing materials is critical to ensuring product performance. Agilent’s reliable and robust range of instrumentation for polymer characterization delivers fast, actionable information about the composition and response of polymers and composites. Agilent FTIR solutions can tackle any analytical challenge, from routine measurements and troubleshooting to cutting-edge applications.
For insights into both bulk and detailed structure – and for mobile measurements – explore our laboratory FTIR bench, microscopy, and chemical imaging systems. Handheld instruments, such as the Agilent 4300 Handheld FTIR, provide superior quality information fast, in any location.
The Agilent GPC/SEC portfolio also offers market-leading instrumentation, columns, standards, and data analysis software for polymer characterization. For accelerated decision times in batch testing with accurate molecular weight information, check out our industry-leading HPLC systems.
>> Update My Profile | Subscribe to Access Agilent | Article Directory
Figure 1.
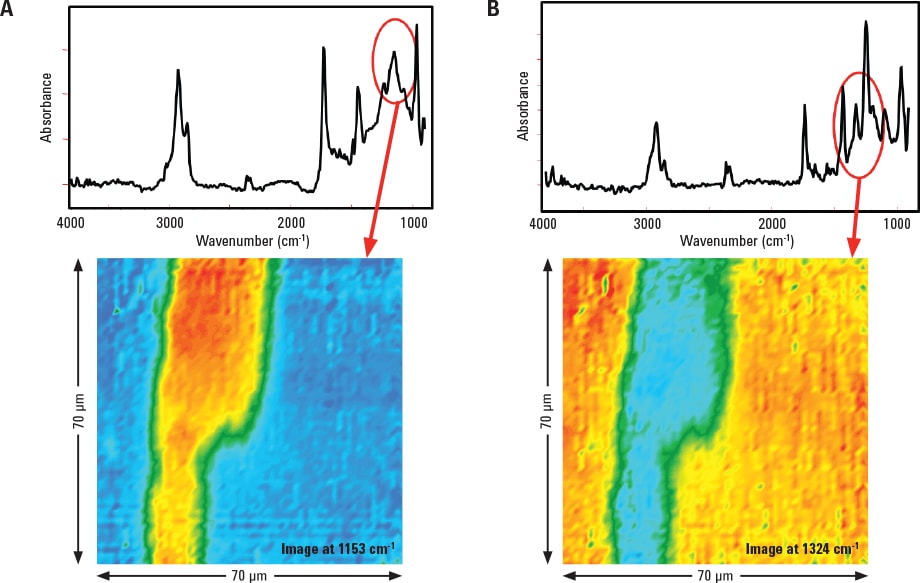
Chemical images and spectra of a polymer film. 1a. Warm colors highlight areas of high absorbance intensities associated with an acryloid. 1b. Regions where intrinsic absorbances associated with the bulk polymer are present (warm colors) or absent (cool colors).