
Access Agilent eNewsletter, March 2015
>> Update My Profile | Subscribe to Access Agilent | Article Directory
New solution delivers rapid, reproducible evaluation of plasma proteins
By Christoph H. Borchers and Gary H. Kruppa
CSO, CEO, MRM Proteomics Inc.
Andrew Percy and Yassene Mohammed
Staff Scientists, University of Victoria/Genome BC Protein Centre
Mike Hagmaier
Agilent Marketing Programs Manager
Mass spectrometry (MS) based quantitation is performed to address biological and clinical research-related queries for systems biology applications. The most precise technique involves multiple reaction monitoring (MRM)-MS with stable isotope-labeled standards (SIS).
Agilent recently teamed up with MRM Proteomics, a partner that provides a suite of PeptiQuant™ kits for the QC of quantitative proteomics workflows and PeptiQuant Biomarker Assessment Kits (BAKs) for biomarker discovery and verification studies. The goal was to optimize PetptiQuant kits and BAKs for use with Agilent 6490 and 6495 Triple Quadrupole LC/MS systems in combination with Agilent 1290 Infinity LC systems, and additional Agilent LC/MS solutions – to achieve rapid, reproducible analysis of plasma proteins.
 Enlarge
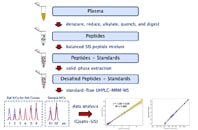
Figure 1. Optimized PeptiQuant BAK-76 workflow for protein quantitation in reference and patient plasma sample.
 Enlarge
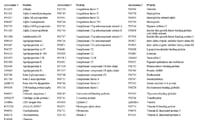
Figure 2. The proteins in MRM Proteomics’ PeptiQuant BAK-76 kit.
Precise quantitation of protein biomarkers for combating cancer and heart disease
Developing sensitive methods to reproducibly quantify proteins in blood plasma is necessary to confirm putative biomarkers, many of which have been reported to be correlated to cancer [1] and cardiovascular disease [2], among others. To that end, sets of highly multiplexed MRM PeptiQuant assays for the precise quantitation of many candidate protein biomarkers in undepleted and non-enriched human biofluids [3-6] and dried blood spots [7] were developed at the University of Victoria/Genome BC Protein Centre under the direction of Christoph Borchers, and are available as services from MRM Proteomics.
PeptiQuant Biomarker Assessment Kits (BAKs) are also now available to the proteomics community to aid in standardization and to expedite biomarker evaluation. MRM Proteomics’ first BAK, the PeptiQuant BAK-76, uses a bottom-up LC/MRM-MS workflow with balanced SIS peptide mixtures. Figure 1 shows that the PeptiQuant BAK-76 allows fast and accurate MRM based quantitation of 76 proteins from human plasma.
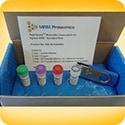
This method has been optimized for analytical precision in routine sample analyses. The PeptiQuant BAK-76 contains the materials and documentation needed for the chemical analysis, i.e., reference plasma, trypsin, and the SIS peptide mixtures (Figure 2). The SIS peptide mixtures supplied with this kit are for post-digestion addition to the plasma reference sample (for constructing 6-point standard curves with a concentration range of 500-fold), and for addition to the user’s samples.
 Enlarge
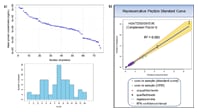
Figure 3. 3a) Plasma concentrations of the 76 proteins (101 peptides) in the reference plasma sample.3b) Representative standard curve and QA output from Qualis-SIS.
Software delivers peak response data for easy results interpretation
MRM Proteomics’ Qualis-SIS software [8] uses the peak response data exported from Agilent MassHunter software for automated curve generation and easy interpretation of the quantitative results through a color-coded, quality assessment matrix. The concentration range of these candidate protein biomarkers spans 4 or more orders of magnitude in concentration, from 1.0 mg/mL (apolipoprotein A-I) to 184 ng/mL (complement C1q subcomponent subunit A) – as shown in Figure 3a. Quantitation is performed rapidly and automatically without manual inspection of the response curves from the MRM data, removing any subjectivity based on the user’s inspection of the data. Concentrations of the proteins in the reference plasma were measured over 2 months, showing the robustness of these methods –and the quality of each measurement was assessed, automatically by the Qualis-SIS software (Figure 3b).
A powerful collaboration for rapid and reproducible MRM-based quantitation of proteins
Use of the MRM Proteomics PeptiQuant BAK-76 kit, together with established PeptiQuant QC kits [9,10] and an Agilent 6490 and 6495 Triple Quadrupole LC/MS system combined with the Agilent 1290 Infinity LC system, leads to rapid and accurate evaluation of these 76 high-to-moderate abundance proteins in human plasma – and improves method reproducibility and transferability between laboratories. PeptiQuant kits and services are available today from MRM Proteomics Inc, and additional PeptiQuant BAKs are in development. Beginning in March 2015, PeptiQuant kits will only be available through Cambridge Isotope Laboratories, Inc.
Turn to Agilent for powerful, reliable Integrated Biology solutions covering a wide range of application areas. Then take a moment to explore Agilent’s Mass Spectrometry portfolio today.
References
- Chambers, A G, Percy, A J, et al., ERP, 2014. 11 137-48.
- Percy, A J, Byrns, S, et al., ERP, 2013. 10 567-78.
- Percy, A J, Yang, J, et al., JPR, 2014. 13 3733–3747.
- Percy, A J, Simon, R, et al., JPR, 2014. 106 113-24.
- Percy, A J, Chambers, A G, et al., MiMB, 2013. 1000 167-189.
- Domanski, D, Percy, A J, et al., Proteomics, 2012. 12 1222-43.
- Chambers, A G, Percy, A J, et al., MCP, 2013. 12 781-91.
- Mohammed, Y, Percy, A J, et al., JPR, 2014, submitted.
- Percy, A J, Chambers, A G, et al., JPR, 2013. 12 222-33.
- Percy, A J, Chambers, A G, et al., Proteomics, 2013. 13 2202-2215.
>> Update My Profile | Subscribe to Access Agilent | Article Directory
Figure 1.
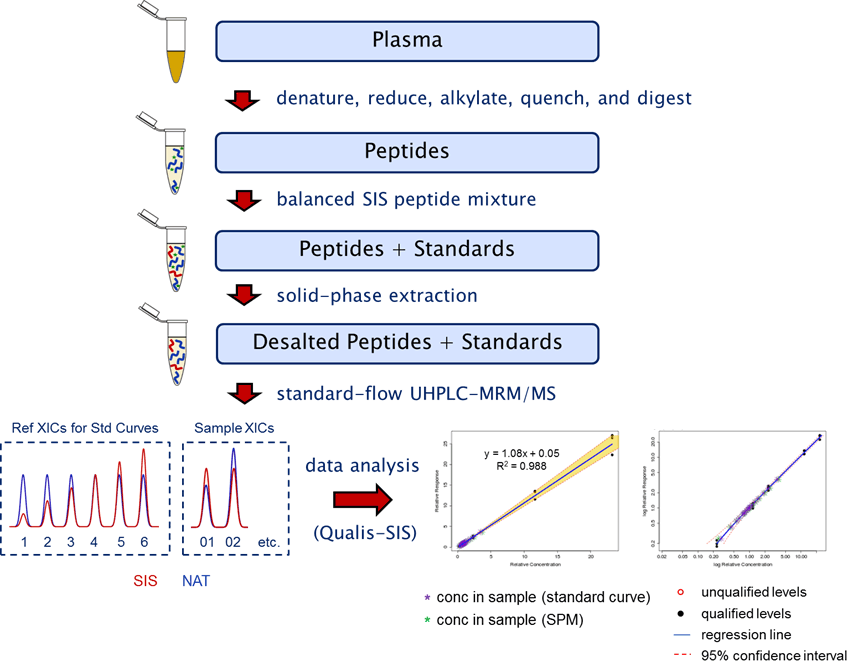
Optimized PeptiQuant BAK-76 workflow for protein quantitation in reference and patient plasma sample.
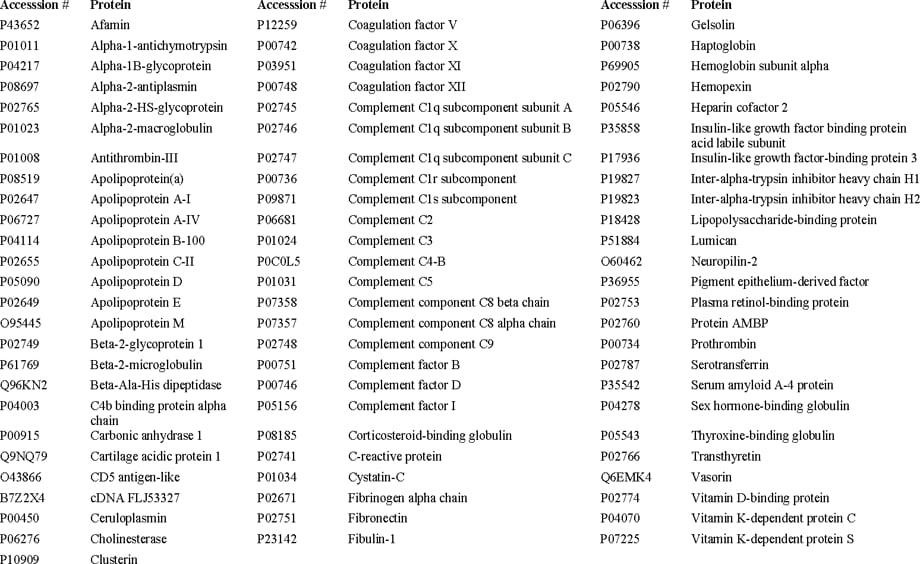
Figure 3.

3a) Plasma concentrations of the 76 proteins (101 peptides) in the reference plasma sample. All concentrations were measured in 5 replicates, determined by Qualis-SIS from peptide standard curves with CVs of <15%. 3b) Representative standard curve and QA output from Qualis-SIS. All determined concentrations for complement factor I (determined concentration 14.3 µg/mL in the reference sample) in the 20 samples were within the range of linearity, as evidenced by the plotted asterisks (purple, from regression analysis; green, single point measurment).