Access Agilent eNewsletter June 2015
>> Update My Profile | Subscribe to Access Agilent | Article Directory
Agilent GC-ICP-QQQ solution achieves sub-ppb detection limits for hydride gas contaminants
By William Geiger
CONSCI, Ltd.
Emmett Soffey and Chris Scanlon
Agilent Applications Engineers
Steve Wilbur
Agilent Software Product Manager, ICP-MS Systems
Hydride gases, such as phosphine and arsine, are important contaminants in process chemicals used in both the petrochemical and semiconductor industries. The presence of phosphine, arsine, hydrogen sulfide, and carbonyl sulfide in polymer grade ethylene or propylene can have a deleterious effect on catalysts used in the production of polypropylene plastics. In the semiconductor industry, phosphine is used as a precursor for the deposition of group III-V compound semiconductors, and as a dopant in the manufacturing of semiconductor devices, such as diodes and transistors. The presence of unwanted hydride gas impurities can have a profound effect on the performance of the final device.
To date, measurement of these contaminants at ppb levels has been sufficient, but increasing competition within the industry and evolving performance criteria are pushing specifications ever lower. In addition, high purity gas manufacturers often require analytical detection limits 5-10 times lower than reported specifications. In anticipation of increasing industry demand for lower level detection, a new high sensitivity GC-ICP-MS method using the Agilent 8800 Triple Quadrupole ICP-MS (ICP-QQQ) was developed for this application.
Gas analysis using GC-ICP-QQQ
We coupled an Agilent 7890B GC to an Agilent 8800 ICP-QQQ using the Agilent GC-ICP-MS interface. The 8800 ICP-QQQ was operated in MS/MS mass-shift mode using oxygen as the collision/reaction cell (CRC) gas for the measurement of Ge, As, P, and S. Hydrogen cell gas mode was used for the on-mass measurement of the primary isotope of Si at m/z 28. Tuning conditions were almost identical for the two modes, the only differences being in the Kinetic Energy Discrimination (KED) voltage and the cell gas flow.
 Enlarge
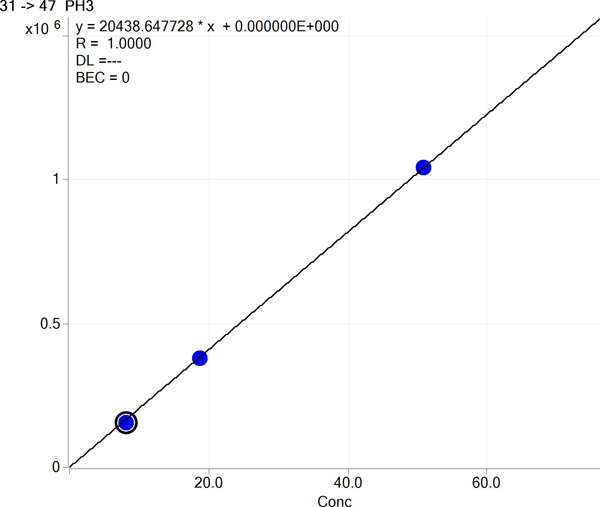
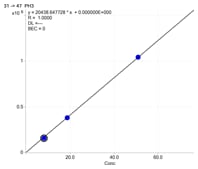
Figure 1. Phosphine calibration curve with an R value of 1.000 over the concentration range.
 Enlarge
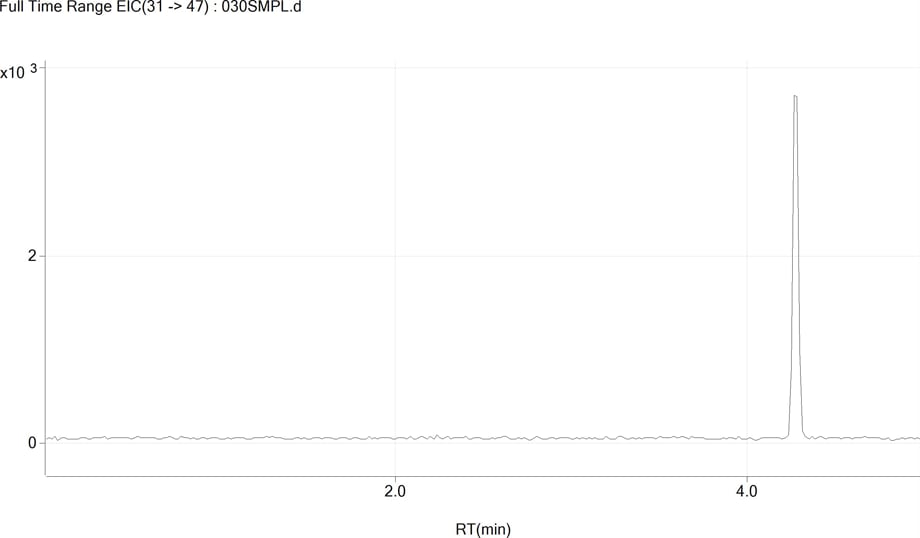
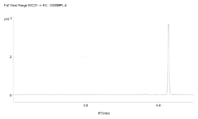
Figure 2. Chromatogram of 0.42 ppb PH3 standard. S/N: 96.9.
Experiment establishes detection limit for phosphine
The purpose of this experiment was to establish a detection limit for phosphine (PH3) using GC-ICP-QQQ under ideal conditions. Q1 was set to m/z 31 (the precursor ion 31P+) and Q2 was set to m/z 47 to measure the product ion 31P16O+. Since the eluting peaks are relatively narrow, with duration of no more than 〜12 seconds, a maximum of 1 second was set for the total scan time. For the single element analysis of phosphine (measured as PO+), an integration time of 1.0 second was used. A multi-point calibration curve was generated for PH3 at concentrations of 8.2, 18.8 and 50.8 ppb (Figure 1). This covers the representative concentration range required for the measurement of this contaminant.
A low-level phosphine standard (〜0.42 ppb) was also prepared, to allow the detection limit (DL) to be calculated. Two different methods for DL calculation were used:
- Two times the signal-to-noise (S/N) of the phosphine peak in the low-level standard based on “Peak to Peak" noise method
- The standard deviation of the concentrations measured in seven replicate analyses of the low-level standard.
In the chromatogram shown in Figure 2, a S/N ratio of 96.9 was determined for the phosphine peak. Using the equation DL = 2 x ((concentration of standard) / (S/N)), a detection limit approximation of 8.67 ppt was calculated based on 2 x ((0.42 ppb) / (96.9)). Using the standard deviation method, where multiple replicates of the low level standard were analyzed, the detection limit was 19 ppt.
Analysis of additional hydride gases with GC-ICP-QQQ methodology
The GC-ICP-QQQ method was applied to the multielement analysis of germane, arsine and phosphine within a single analysis. Ge and As were measured as their O2 reaction product ions, GeO+ and AsO+, as was the case with P (PO+). Hydrogen sulfide (H2S) and carbonyl sulfide (COS) were also analyzed using O2 mass-shift mode, based on the ICP-QQQ measurement of sulfur as the 32S16O+ reaction product ion at m/z 48. For the analysis of silane, Si was measured directly (on-mass) at its major isotope 28Si, using H2 cell gas. The primary polyatomic interferences on 28Si+ are 12C16O+ and 14N2+, due to the presence of CO2, N2, and O2 in the argon supply and from air entrainment into the plasma. H2 was selected as the reaction gas as both the CO+ and N2+ interferences react readily with H2 cell gas. Si+ remains unreactive and so can be measured, free from interferences, at its original mass.
Comparison of GC-ICP-QQQ and GC-ICP-MS detection limit techniques
For comparison purposes, H2S, COS, PH3, GeH4, AsH3, and SiH4 were analyzed by GC-ICP-QQQ with the 8800 ICP-QQQ, and GC-ICP-MS, using the same GC method with an Agilent 7900 conventional quadrupole ICP-MS. A summary of the detection limits (DLs) for both techniques is given in Table 1. For analytes where the background noise is very low (Ge-74, As-75), single digit ppt level detection limits are easily achieved using either GC-ICP-MS or GC-ICP-QQQ. However, for analytes that are prone to higher backgrounds (P-31 and S-32), significantly lower detection limits can be achieved by using MS/MS with O2 cell gas and measuring the oxygen addition reaction product ions PO+ and SO+ in mass-shift mode. In addition, MS/MS mode with H2 cell gas provides effective removal of background interferences at mass 28, allowing on-mass measurement of Si at its primary isotope.
Hydride gas |
Agilent 8800 ICP-QQQ |
Agilent 7900 ICP-MS |
||
|---|---|---|---|---|
H2S |
|
DL, ppb |
|
DL, ppb |
|
32 ->48 (O2) |
|
32 (No gas) |
|
|
MDL 7 reps |
0.21 |
MDL 7 reps |
0.62 |
|
MDL 2 x S/N |
0.11 |
MDL 2 x S/N |
0.22 |
COS |
|
|
|
|
|
32->48 (O2) |
|
32 (No gas) |
|
|
MDL 7 reps |
0.12 |
MDL 7 reps |
0.51 |
|
MDL 2 x S/N |
0.11 |
MDL 2 x S/N |
0.21 |
PH3 |
|
|
|
|
|
31->47 (O2) |
|
31 (No gas) |
|
|
MDL 7 reps |
0.019 |
MDL 7 reps |
0.139 |
|
MDL 2 x S/N |
0.009 |
MDL 2 x S/N |
0.077 |
GeH4 |
|
|
|
|
|
74->90 (O2) |
|
74 (No gas) |
|
|
MDL 7 reps |
NA |
MDL 7 reps |
0.013 |
|
MDL 2 x S/N |
0.0038 |
MDL 2 x S/N |
0.0013 |
AsH3 |
|
|
|
|
|
75->91 (O2) |
|
75 (No gas) |
|
|
MDL 7 reps |
NA |
MDL 7 reps |
0.016 |
|
MDL 2 x S/N |
0.0013 |
MDL 2 x S/N |
0.006 |
SiH4 |
|
|
|
|
|
28->28 (H2) |
|
28 (H2) |
|
|
MDL 7 reps |
0.14 |
MDL 7 reps |
1.09 |
|
MDL 2 x S/N |
0.196 |
MDL 2 x S/N |
1.18 |
*NA = not available
Table 1. Detection limit comparison between GC-ICP-QQQ and GC-ICP-MS.
GC-ICP-QQQ sets benchmark detection limits
The significantly lower background and higher sensitivity of the Agilent 8800 ICP-QQQ resulted in a GC-ICP-QQQ method that shows a clear advantage for the determination of a range of contaminants in high purity gases at the low detection levels demanded by the industry. Compared to GC-ICP-MS with conventional quadrupole ICP-MS, GC-ICP-QQQ DLs for silane, phosphine, hydrogen sulfide, and carbonyl sulfide were lower by a factor of 5 to 10 with silane detection limits in the 〜200 ppt range and phosphine detection limits in the 〜15 ppt range. To learn more, download the Agilent Application Note, 5991-5849EN.
Keep up-to-date with the Agilent ICP-MS Journal
Are you interested in trace metals analysis and eager to keep up-to-date with the latest developments in the field of ICP-MS? Then take a closer look at Agilent’s dedicated ICP-MS Journal. Published four times a year and available as a PDF, you can view the latest issue of the ICP-MS Journal, plus all previous issues, by visiting the ICP-MS Journal Archive. To receive your personal copy of the ICP-MS Journal sent direct to your inbox, please subscribe now.
>> Update My Profile | Subscribe to Access Agilent | Article Directory