Access Agilent eNewsletter August 2015
>> Update My Profile | Subscribe to Access Agilent | Article Directory

Ask the Expert: What role does software play in biosimilar analysis?
By Ning Tang
Agilent Biopharma Application Chemist
Preceding articles in this four-part series focused on chromatographic techniques to characterize innovator and biosimilar molecules. In this final article of our biosimilar series, we explore the LC/MS data analysis tools that streamline the comparison between the biosimilar and originator to improve productivity and speed up biosimilar development.
Q: Why is software important?
Answer: Biologics are complex and more sensitive to changes in manufacturing processes. A reference to the innovator product is an integral component of biosimilar development. LC/MS software is critical to the success of your analysis, as it couples multiple and powerful data-processing algorithms with sophisticated sequence- and database-matching tools. These tools enable fast and accurate identification of intact proteins, peptides, and their variants in simple and complex mixtures.
 Enlarge
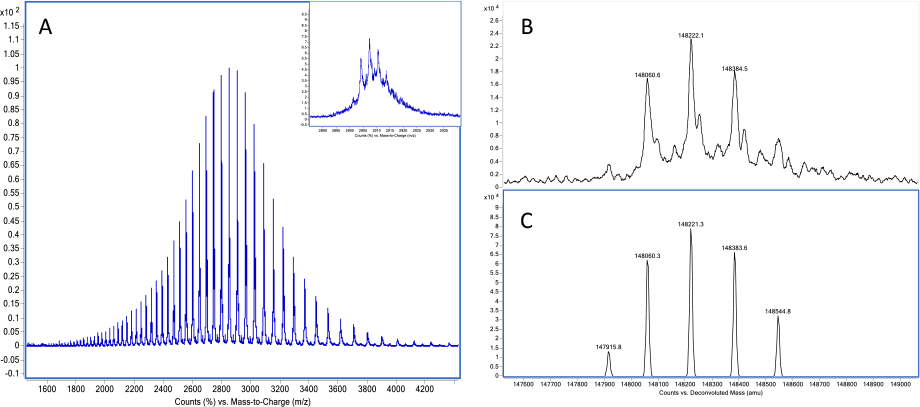
Figure 1. A) Charge envelope of intact Herceptin (trastuzumab) acquired by LC/MS. B) maximum entropy deconvolution result of trastuzumab. C) peak-modeling deconvolution result of trastuzumab.
Let’s examine Agilent MassHunter BioConfirm software with its unique capabilities that set it apart for biosimilar analysis. The software provides several different algorithms for mass spectral deconvolution, optimized for intact proteins and peptides, as well as for different sample complexities. Using electrospray ionization conditions, the charge envelope of the mass spectra contains several multiply charged peaks (Figure 1A). Agilent Maximum Entropy deconvolution algorithm converts these complex spectra to simple zero-charge spectra (Figure 1B), which directly provide the molecular weights of proteins and their variants.
This method transforms an m/z raw spectrum of one or more intact proteins into the most probable zero-charge mass spectrum. Maximum entropy deconvolution works reliably for low complexity protein data and for relatively simple protein mixtures.
Q: What about artifacts?
Answer: Agilent MassHunter BioConfirm offers another advanced data deconvolution algorithm, peak-modeling deconvolution (pMod), which improves deconvolution results by applying an automatic peak modeling technique. This algorithm delivers the most probable deconvolution results, which are virtually free of artifacts. pMod gives you improved signal-to-noise ratios and enhanced resolution of protein peaks for precise analysis (Figure 1C).
The algorithm starts with maximum entropy deconvolution. Then, based on the maximum entropy result, pMod automatically generates mass spectra peak models without manual intervention and applies these models through fitting and validation. Spectral data that do not fit the model are rejected as noise. Therefore, the pMod result is much cleaner than the maximum entropy deconvolution result and produces fewer artifacts. Using this process, pMod generates a highly resolved zero-charge spectrum and a set of mass-precision assessments for every peak.
 Enlarge
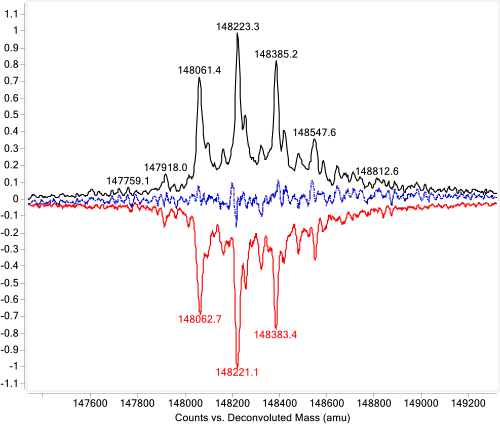
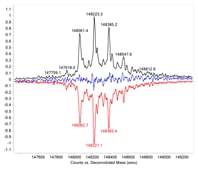
Figure 2. Mirror plot of intact originator and biosimilar.
Q: How do I compare the quantity of different variants?
Answer: Mirror plots are ideal for this task. During biosimilar development, comparison of the molecular similarity between the biosimilar and the originator is critical. Unlike small molecule drugs, biologics are heterogeneous and present multiple modifications, such as glycosylation. Measuring the protein masses accurately and identifying all the variants are only the first steps in biosimilar characterization. Comparing the relative abundance of different variants is also important. Often, a visual comparison gives the most direct confirmation of the similarities between two biologics. Agilent MassHunter BioConfirm generates a mirror plot of two samples (Figure 2) to do this.
In this example, the originator and biosimilar were analyzed by LC/Q-TOF. Protein molecular weights were accurately confirmed and the major glycoforms identified. The deconvoluted mass spectra were mirror plotted for easy comparison. The black trace is Herceptin (trastuzumab) and the red trace is the biosimilar. The blue trace is the difference between the two samples. The nearly flat blue line shows that the two samples have great similarity at the intact level.
 Enlarge
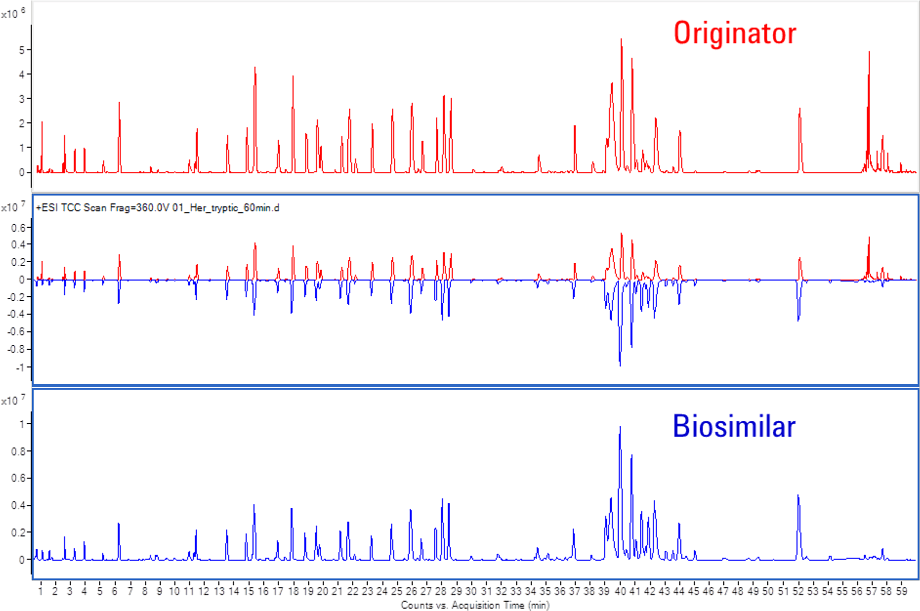
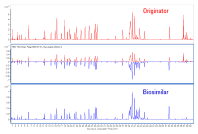
Figure 3. Mirror plot of Herceptin and biosimilar tryptic peptide mapping chromatograms.
Q: Is there a way I can speed up peptide mapping?
Answer: Peptide mapping is an essential step in characterizing biologics. However, for peptide mixtures that contain many components, manual analysis of LC/MS results can be time consuming. Agilent MassHunter BioConfirm provides the Molecular Feature Extraction (MFE) algorithm to automate the process. MFE finds the peptides in the LC/MS chromatogram and determines their masses via resolved isotope deconvolution. It then uses the resolved isotopes to determine directly the charge states for the peptides, and looks for related ion clusters that represent the same peptide with neighboring charge states.
The Comparative Analysis module of BioConfirm is important for the analysis of two different samples, such as biosimilar and originator. This module enables direct visual comparison of different LC/MS runs from two peptide-mapping samples. Mirror plots and tabular comparisons make it easy to compare the samples visually, as shown in Figure 3.
Q: Where do I go to find out more?
Answer: During the course of this four-part Ask the Expert series, we took "deep dives" into the steps necessary to find and evaluate an effective biosimilar, with techniques similar to those used to develop and evaluate innovator drugs. All the featured articles are freely available in our Prepping Biosimilars compendium.
Agilent software tools, together with advanced biocolumns and LC/MS systems, greatly increase productivity and speed up biosimilar development. Learn more about Agilent biopharma solutions and advance your biopharma research.
>> Update My Profile | Subscribe to Access Agilent | Article Directory