
Access Agilent eNewsletter April 2015
>> Update My Profile | Subscribe to Access Agilent | Article Directory

Importance of good chromatography in bioanalytical methods
By Sreelakshmy Menon and Siji Joseph
Application Scientists at Life Science Center India (LSCI)
Smriti Khera, Ph.D.
Agilent Pharmaceutical Segment Marketing Manager
The analysis of drug metabolites from biological matrices is a very challenging endeavor. Analytes of interest need to first be isolated from matrix interferences. These analytes can be difficult to remove and may induce ion suppression in the mass spectrometer, leading to loss of sensitivity. Frequently with these studies, parent drug disappearance and metabolite formation must be monitored simultaneously – presenting a dynamic range challenge. In addition, detecting low concentration metabolites in small samples requires high sensitivity (nM to fM) of detection. What’s more, these analyses have to be consistently accurate, reproducible, and even transferable across laboratories.
Sound methods yield better results in bioanalysis
Given the sensitivities and dynamic range of detection typically needed from a bioanalytical method, it is without a doubt that an LC/MS is the instrument of choice for these analyses. However, a good chromatographic method up front of the mass spectrometer can have a big impact on the final analysis as well. In this article, we illustrate the importance of good chromatography in bioanalysis via the quantitation of two drugs, methotrexate and sulfasalazine, from plasma samples. This analysis was carried out using an Agilent 1290 Infinity Binary LC System and an Agilent 1290 Infinity Diode Array Detector equipped with an Agilent 60-mm Max-Light High Sensitivity Flow Cell. It was operated with Agilent Chemstation OpenLab CDS Software Version C.01.05. [1]
Combination treatment for rheumatoid arthritis: methotrexate + sulfasalazine
Methotrexate (MTX) is considered an ‘anchor drug’ in the treatment of rheumatoid arthritis (RA) and is among the most effective disease-modifying anti-rheumatic drugs (DMARDs) with less toxicity and better tolerability. But, MTX alone is often not able to fully control disease activity. In fact, MTX is most frequently used in combination with other non-biological DMARDs by 99% of all rheumatologists. One such drug often used in combination with MTX is sulfasalazine (SSZ). While many analytical methods exist for the analysis of either MTX or SSZ alone, no analytical methods have been reported for the simultaneous determination of MTX and SSZ.
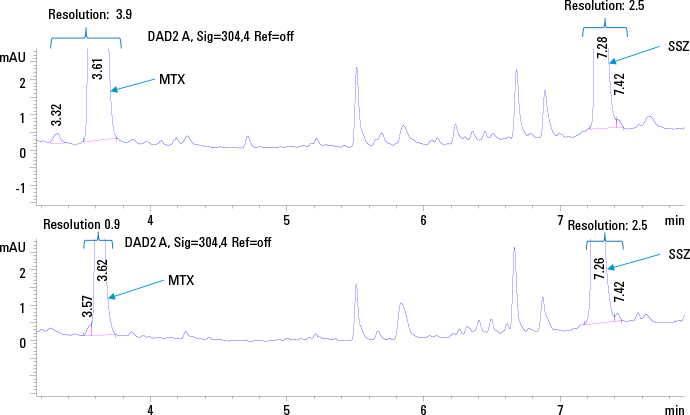
Figure 1. HPLC chromatogram of standard plasma solution 12.5 ng/µL of MTX and SSZ using SPE (top trace) and protein precipitation (bottom trace) at 304 nm.
 Enlarge
Figure 2. Elution profile of standard plasma solution of 2 ng/µL of MTX (Rt = 3.6 min) and SSZ (7.2 min) using SPE at 304 nm overlaid with blank plasma chromatogram.
 Enlarge
Figure 3. Chromatogram for MTX at LLOQ overlaid with blank traces in duplicates.
A simple HPLC/DAD method for quantitating methotrexate and sulfsalazine
We used an Agilent 1290 Infinity Binary LC System for the simultaneous determination of MTX and SSZ in plasma. The chromatographic method was optimized for selectivity between the two analytes, as well as from background matrix interferences. We also compared two sample preparation strategies namely off-line solid phase extraction (SPE), as well as protein precipitation to see what impact they each have on the final analyses (Figure 1).
The extraction efficiency for protein precipitation versus SPE was evaluated by comparing the area under the curve (AUC) of the analyte peaks from the plasma calibration standards with the AUC observed for standard solutions at a concentration of 12.5 ng/µL. As expected, we found that SPE with Bond Elut-C18 cartridges (100 mg, 3 mL) allowed better extraction efficiency, better resolution, and thus a more sensitive detection across a wider calibration range. For the quantitative method, sample extraction with SPE was selected.
Next, we optimized the chromatography for best selectivity for MTX and SSZ as well as resolution of both the target analytes from matrix peaks, within a total run time of 15 minutes (Figure 2). An Agilent 3.0 x 150 mm, 2.7µm Poroshell column was found highly retentive for the analytes, and the best separation was achieved by using gradient elution. A low organic mobile phase concentration (10% organic) at the beginning of the gradient resulted in the best resolution of the analytes from the initial polar matrix background. Also the late eluting analyte SSZ was well resolved from late eluting matrix interferences by maintaining a high organic mobile phase composition (95% organic) for five minutes at the end of the gradient run prior to re-equilibration.
Method validation for critical analytical performance criteria
This method was shown to be linear across the dynamic range of 0.02-100 ng/µL for MTX and 0.1-100 ng/µL for SSZ. The LOD and LLOQ for MTX were 0.01 and 0.02 ng/µL with S/N values of 6 and 10 respectively. While for SSZ the LOD and LLOQ were 0.05 and 0.1 ng/µL with S/N values of 8 and 18 respectively. Figure 3 shows the typical chromatogram for MTX at LLOQ overlaid with blank traces in replicates. The chromatographic reproducibility at LLOQ was verified by replicate injections. The %CV of AUC and retention time at LLOQ were 0.02% and 1.46% respectively for MTX, and 0.01% and 0.79% respectively for SSZ 0.79% respectively for SSZ.
The method was f with FDA guidance, using quality control samples for critical analytical performance criteria of recovery, reproducibility, selectivity, accuracy, and precision. These results are summarized in Table 1.
QC |
Target (ng/µL) |
MTX (n=5) |
SSZ (n=5) |
||||||||
|---|---|---|---|---|---|---|---|---|---|---|---|
Mean Recovery (ng/µL) |
Accuracy (%) |
CV (%) |
Rt RSD (%) |
AUC RSD (%) |
Mean Recovery (ng/µL) |
Accuracy (%) |
CV (%) |
Rt RSD (%) |
AUC RSD (%) |
||
Low QC |
0.8 |
0.70 |
87.7 |
1.02 |
0.03 |
0.26 |
0.82 |
102.2 |
0.86 |
0.09 |
0.34 |
Middle QC |
8.0 |
8.1 |
101.1 |
0.26 |
0.03 |
0.25 |
7.5 |
94.2 |
0.28 |
0.02 |
0.41 |
High QC |
80.0 |
75.5 |
94.3 |
0.29 |
0.03 |
0.29 |
78.1 |
97.6 |
0.29 |
0.02 |
0.29 |
Table 1. QC sample results summarizing mean recoveries, accuracies, %CV of accuracies, Retention time (Rt) RSD, and AUC RSD.
Optimize bioanalytical methods with Agilent HPLC/DAD solutions
This simple and robust HPLC/DAD method is the first reported for the simultaneous quantitation of methotrexate and sulfasalazine – allowing for a more sensitive and wider calibration range. These results were achieved using a much smaller (200 µL) volume of plasma sample than any previously reported UV methods for MTX.
Additionally, this method illustrates the role good chromatography can play in optimizing each of the critical performance criteria required for a bioanalytical method. While the desired method sensitivity of nM to fM which are commonly required for these studies cannot be easily achieved without using mass spectrometric detection, optimization of chromatography can be critical to achieving this goal during method development.
More details on this application are found in the February issue of LCGC magazine. Then explore Agilent solutions for the pharmaceutical industry.
References
- Smriti Khera, Sreelakshmy Menon, Siji Joseph; Simultaneous Determination of Methotrexate and Sulfasalazine in Plasma by HPLC–DAD; LCGC North America Volume 33 Number 2; February 1, 2015
>> Update My Profile | Subscribe to Access Agilent | Article Directory
Figure 1.
HPLC chromatogram of standard plasma solution 12.5 ng/µL of MTX and SSZ using SPE (top trace) and protein precipitation (bottom trace) at 304 nm.

