Access Agilent eNewsletter, October 2014
>> Update My Profile | Subscribe to Access Agilent | Article Directory

Now – Maximize your GC/MSD’s ability to identify and characterize unknowns
By Badr Astiphan
Agilent GC/MSD Product Manager
The current industry standard for determining a compound’s mass information is the 5977A Single Quadrupole GC/MSD in Electron Impact ionization mode. The nominal mass information produced by this technique is accurate to about ± 0.5 Da, which is sufficient for most qualitative and quantitative applications.
However, there are times when a higher degree of mass accuracy is desired to help eliminate ambiguity in compound identification, such as when a spectral library search returns high scores corresponding to multiple compounds. In order to help eliminate this ambiguity, Agilent has teamed up with Cerno Biosciences to improve the accuracy of mass assignment by up to 100X in data generated on an Agilent 5977A Series GC/MSD system – when working in concert with MassWorks™ Accurate Mass software.
Combined hardware-software solution dramatically increases accuracy
MassWorks is an easy-to-use, post-acquisition software package that determines accurate mass and elemental composition using nominal mass data acquired using a GC/MSD reported in raw scan mode. But then it proceeds one step further, employing an innovative algorithm that extends mass assignment confidence and suggests possible empirical molecular formulae for either molecular or fragment ions.
 Enlarge
Figure 1. A mass spectrum before (black) and after (red) MassWorks calibration for a PFTBA calibration ion (C3F5) with accurate masses assigned.
Unique calibration technique improves the quality of your data
Theoretical MS peak positions, as well as the various isotopes and their abundances, are well known and serve as the basis for this unique calculation technique:
- PFTBA tune gas, which is readily available on an Agilent 5977A GC/MSD, is used as the calibration compound.
- A calibration is performed on the mass axis and the spectral line shape. Accurate masses are assigned to the mass peaks (shown in Figure 1).
- Using elemental bounds set by the user and the accurate mass information that is assigned to the mass speaks, a list of candidate molecular formulae is calculated.
- Accurate mass information is combined with isotopic distribution data to minimize the number of possible molecular formulae that are calculated using the elemental bounds specified by the user.
- A theoretical mass spectrum is then determined for each of the calculated candidate formulae from the list and compared with the measured mass spectrum after the calibration.
 Enlarge
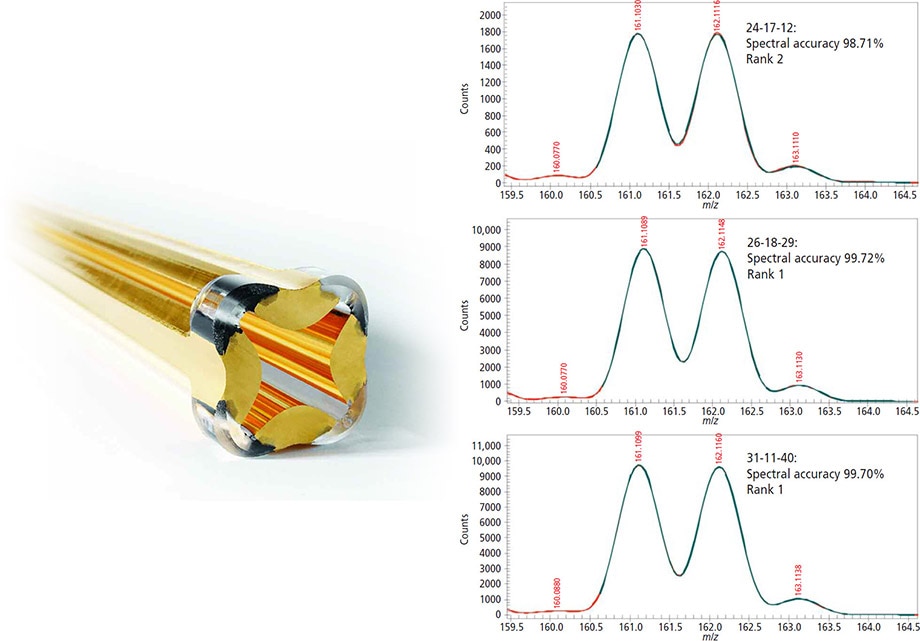
Figure 2. The calibrated mass spectrum (red) overlaid with the theoretical mass spectrum (cyan) for the correct formula C10H14N2 on the first day of experimentation (top), two days later (middle), and one week later (bottom).
End result: high quality data you can trust
Since high quality data continues to be critically important in every industry and for every application, Agilent remains steadfast in its ongoing commitment to consistently exceed customer requirements for data quality. Our proprietary gold-plated, heated quartz quadrupole (shown in Figure 2) is the heart of the Agilent 5977A GC/MSD. Its industry leading robustness, stability, and reproducibility help maximize MassWorks’ ability to produce accurate mass data, day after day, run after run, scan after scan, and also allows you to minimize the need to recalibrate in order to continue to achieve high mass and spectral accuracy.
The advantages of the Agilent 5977A GC/MSD with MassWorks™ software
An Agilent 5977A GC/MSD combined with MassWorks will enable you to maximize the scope and quality of information produced from your analyses like never before – all in an affordable and easy to use package. If you would like to gain additional confidence in the identification of your compounds, we urge you to consider the Agilent 5977A GC/MSD with MassWorks™ accurate mass software package. To order, contact your Agilent Representative today.
>> Update My Profile | Subscribe to Access Agilent | Article Directory