Access Agilent eNewsletter, September 2013
>> Update My Profile | Subscribe to Access Agilent | Article Directory

Guidelines to accurate peptide mapping
By James Martosella
Agilent Biopharma Applications Scientist, CSD Bioapplications
A peptide map is a fingerprint of a protein and the end product of several processes that provide a comprehensive understanding of the protein being analyzed. It involves four major steps: isolation and purification of the protein, selective cleavage of the peptide bonds, chromatographic separation of the peptides, and their validation analysis.
Peptide mapping is a comparative procedure that confirms the primary structure of the protein and detects alterations in structure. Additionally, it demonstrates process consistency and genetic stability. A peptide map should contain enough peptides to be meaningful, include positive identification of the protein, maximize coverage of the complete peptide sequence, and provide additional information and sequence identification beyond that obtained at the non-digested protein level.
Because a profile might contain more than 100 peaks representing individual peptides and their derivatives, mapping requires knowledge of various sample preparation methods, powerful separation techniques, and validated protocols.
Protein digestion enhances peptide mapping separation
Although there are many options for optimizing protein digestion, a number of common steps are involved (Table 1).
Procedure |
Intended effect |
General experiment |
|---|---|---|
1. Sample prep |
Prepare sample for digestion |
Depletion, enrichment, dialysis, desalting |
2. Selection of cleavage agent |
Specific cleavage requirement |
Chemical or enzymatic. Trypsin commonly used because of its well-defined specificity. |
3. Reduction and alkylation |
Reduction – reduces sulfide bonds |
Reduction – DTT, 45 min, 60 °C |
4. Digestion process |
Protein cleavage |
Digestion – pH 8, 37 °C, overnight |
5. Enrichment/cleanup |
Prepare sample for LC or LC/MS |
C18 tips, concentration, dialysis, affinity columns |
Table 1. Five steps for protein digestion
Key components to successful peptide mapping
The most widely used peptide mapping column method, especially in biopharma, is reversed-phase chromatography (RPC). The general approach in developing a practical RPC method requires a good understanding of peptide-specific column selection requirements and method development. Although many of the same chromatographic principles used in small molecule separations also apply to the separation of peptides, there are a number of condition-specific variables for optimizing the peptide method (Table 2).
Variable |
Characteristics |
Benefits |
|---|---|---|
Column |
Superficially porous |
Shorter diffusion path allows for separations of larger molecules at high linear velocities without increased backpressure and improved peak shape and resolution |
Mobile phase |
Additives such as TFA, formic acid, acetic acid |
Increases hydrophobicity of peptides by forming ionic pairs with their charged groups |
Detection |
280 nm, in parallel with 210 nm |
Tryptophan, tyrosine and phenylalanine are sensitive at 280 nm, while 210 nm is relatively unselective, for many other biologicals |
Table 2. Variables for peptide-method optimization
Developing an efficient peptide mapping method
Peptide mapping results can differ based on variations in protocols. Considering the factors in the following five steps can help you pinpoint the most efficient method for your unique mapping needs:
Step 1: Select the initial gradient conditions of column length, mobile-phase composition, flow rate, temperature, and detection. The initial separation should be optimized for retention (k’) and requires a gradient that is not too steep.
Step 2: Adjust the gradient range to minimize run time by eliminating wasted space at the beginning and end of the chromatogram.
Step 3: Vary selectivity; if overlapping bands are observed or run time is too long, selectivity adjustments can be tried.
Step 4: Gradient shape; additional band spacing can be achieved with the use of a non-linear gradient shape as an option to further improve the separation.
Step 5: Adjust column conditions; when band spacing and selectivity are optimized, consider varying run time and column length, or both, to improve resolution and analysis speed.
Peptide mapping characterizations by mass spectrometry
RPC with mass spectrometry (MS) is the method of choice for characterizing peptides and peptide maps (Table 3).
Peptide Mapping Applications |
MS Types |
Benefits |
|---|---|---|
Confirm the identity of a specific protein Get detailed characterization of the protein (e.g. confirmation of N-terminal and C-terminal peptides, high sequence coverage peptide maps, amino acid substitutions, etc.) Screen and identify post-translational modifications (e.g. glycosylations, disulfide bonds, N-terminal pyroglutamic acid, methionine and tryptophan oxidation, etc.) |
Electrospray, MALDI-TOF-MS, as well as fast-atom bombardment (FAB) |
Measures mass accurately with proteolytic peptides ionized intact into the gas phase |
Tandem MS |
Sequences modified proteins and determines the type of amino acid modification |
|
Quadrupole time-of-flight (QTOF) |
Provides more structural information, especially for larger peptides, due to its high resolving power and mass accuracy |
 Enlarge
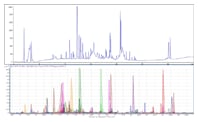
Figure 1. Optimized peptide map of EPO protein providing 100% sequence coverage. The top chromatogram displays a fully optimized EPO digest peptide mapping separation performed on an Agilent AdvanceBio Peptide Mapping, 2.1 x 150 mm column. The bottom chromatogram shows the qualitative analysis (using a molecular feature extractor) for sequence coverage generated on an Agilent Q-TOF.
Table 3. Mass spectrometry for peptide mapping.
Figure 1 is an example of a highly optimized peptide map of erythropoietin protein (EPO) digest using ESI/MS. The optimized chromatographic conditions and MS parameters enabled 100% sequence coverage.
Learn more about peptide mapping processes and options
Peptide mapping – an invaluable tool to the biopharma sector – is a very powerful method and the most widely used identity test for proteins, particularly those produced by recombination. Explore the new Agilent publication, Keys for Enabling Optimum Peptide Characterizations: A Peptide Mapping “How to” Guide to learn more.
>> Update My Profile | Subscribe to Access Agilent | Article Directory
Figure 1.

Optimized peptide map of EPO protein providing 100% sequence coverage. The top chromatogram displays a fully optimized EPO digest peptide mapping separation performed on an Agilent AdvanceBio Peptide Mapping, 2.1 x 150 mm column. The bottom chromatogram shows the qualitative analysis (using a molecular feature extractor) for sequence coverage generated on an Agilent Q-TOF.