Access Agilent eNewsletter, September 2013
>> Update My Profile | Subscribe to Access Agilent | Article Directory

Single Particle-ICP-MS – an outstanding way to characterize individual nanoparticles
By Sébastien Sannac
Applications Engineer, Agilent, France
Soheyl Tadjiki
Science Director, Postnova Analytics Inc., UT, USA
Evelin Moldenhauer
Applications Engineer, Postnova Analytics GmbH, Landsberg, Germany
Interest in nanoparticles (NPs) is on the rise. Due to their unique properties, they are being investigated for use in products and processes in industries ranging from cosmetics, pharmaceuticals and medicine… to food packaging, fuel cell technology and electronics. However, concerns have been raised about their potential impact on both the environment and human health, so there is an urgent need to develop analytical methods suitable for the particular evaluation of NPs. These methods need to be appropriate to the specific properties of nanoparticles, including mass concentration, evaluation of their size, and size distribution.
Parameter |
Value |
|---|---|
RF power |
1550 W |
Carrier gas |
1.05 L/min |
Spray chamber temperature |
2 °C |
Nebulizer pump |
0.1 rps |
Sample depth |
8.0 mm |
Integration time |
3 ms |
Acquisition time |
60 s |
Mass monitored |
107Ag or 197Au |
Table 1. General settings of the Agilent 7700x ICP-MS
In 2004, Degueldre, Favarger and Bitea [1] characterized NPs based on elemental determination using an Agilent 4500 ICP-MS. They discovered that if you introduce samples containing NPs at a low flow rate and the number of particles in the solution is also sufficiently low, analysis using ICP-MS in time-resolved mode makes it possible to collect the signal generated as each individual particle is vaporized in the plasma. Then, each measured data point can be correlated to a size and a mass fraction for a unique NP. This method of NP characterization is called Single Particle ICP-MS analysis (SP-ICP-MS). The key feature of this analysis lies in the capacity of the ICP-MS to collect the data for a single NP. For this reason, care must be applied to the dilution factor and the selection of the integration time, to ensure that the individual particles’ signals can be distinguished.
Successfully determine size distribution of gold and silver NPs by ICP-MS
Measurements of NPs in a mixture of two gold NP standard reference materials – NIST 8012 and NIST 8013 (Gaithersburg, MD, USA) which are certified at 30 and 60 nm respectively – were performed using the Agilent 7700x ICP-MS in time-resolved analysis (TRA) mode. The samples were introduced directly into the ICP-MS system using a standard peristaltic pump with Tygon pump tubing (internal diameter of 1.02 mm) along with an ASX-520 auto-sampler. A rinse solution containing 1% nitric acid was used to ensure sample washout between each analysis. The general settings of the Agilent 7700x system are detailed to the right in Table 1.
 Enlarge
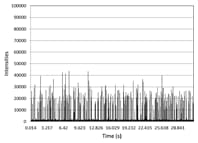
Figure 1. Typical measurement of NPs under the Single Particle mode. Example of the measurement of 30 nm gold NP standard (NIST 8012).
 Enlarge
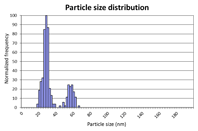
Figure 2. Particle size distribution for a mixture of 30 nm and 60 nm gold NP standards (NIST 8012 and 8013). A dedicated spreadsheet developed by RIKILT (the National Institute of Food Safety in the Netherlands) was used for data conversion.
Figure 1 shows the typical pattern of intensities measured by the Agilent 7700x ICP-MS in single particle (TRA) mode for one of the gold NP standards (NIST 8012). From the raw data, the signals due to the background values are eliminated, and the remaining intensities are converted into particle sizes to give a size distribution pattern.
The particle size distribution pattern for the mixed gold NP reference standards at 30 nm (NIST 8012) and 60 nm (NIST 8013) is displayed in Figure 2. As you can see, the method was clearly able to identify the presence of the two different NP populations, and the peaks for the two different sizes of particles were resolved to baseline. The method has therefore been shown to have sufficient resolution to detect and discriminate different NP sizes that are mixed together in one sample. The absence of a significant number of particle events at a size greater than 60 nm indicates that the sample preparation approach successfully avoided the problem of particle agglomeration. The size distribution pattern in Figure 2 also confirms that the chosen acquisition parameters did not lead to the measurement of more than one NP in each TRA integration period. Multiple NPs measured in a single integration period would have appeared as a larger particle size on the particle size distribution plot. Therefore, the integration time selected in the method was suitable for the discrete analysis of each individual NP introduced in the system.
SP-ICP-MS provides an excellent method for measuring NPs
The SP-ICP-MS method developed for the Agilent 7700x has been successfully applied to the analysis of gold and silver NPs with sizes from 15 to 60 nm. SP-ICP-MS was able to deliver the size distribution, median size, number of particles and the elemental concentration of a given NP sample.
Additional work may be required to fully validate the SP-ICP-MS measurement and data analysis approach, and in particular to validate the assumptions currently being used when converting the measured intensities into NP sizes. Additional approaches should also be developed to confirm the results obtained by the SP-ICP-MS analysis, such as the use of Scanning Electron Microscopy (SEM) or the coupling of Field Flow Fractionation (FFF) devices with ICP-MS.
Learn how you can characterize NPs with the Agilent 7700x ICP-MS
Take a moment now to learn more about the benefits of the Agilent 7700x ICP-MS in single nanoparticle analysis. Download the Agilent Application Note: “Single particle analysis using the 7700x ICP-MS”, 5991-2929EN.
Keep up-to-date with the Agilent ICP-MS Journal
Are you interested in trace metals analysis and eager to keep up-to-date with the latest developments in the field of ICP-MS? Then take a closer look at Agilent’s dedicated ICP-MS Journal. Published four times a year and available as a PDF, you can view the latest issue of the ICP-MS Journal, plus all previous issues, by visiting the ICP-MS Journal Archive. To receive your personal copy of the ICP-MS Journal sent direct to your inbox, please subscribe now.
References
>> Update My Profile | Subscribe to Access Agilent | Article Directory

